Know your website is up everywhere your users are
Monitor website uptime and performance from 9 global regions. Track response times, SSL certificates, and get instant downtime alerts.
Website
Retention
Regions
Min Interval
Everything you need
A closer look at what you get, from the first check to the alert that reaches you.
Global HTTP checks
Confirm your site loads correctly from regions around the world.
SSL monitoring
Get warned before a certificate expires and breaks HTTPS.
Content checks
Verify the homepage actually renders, not just that it returns 200.
Public status page
Show visitors real-time status when something does go wrong.
How it works
Three steps from an empty dashboard to checks that run on their own.
Create your monitor
Point Uptime at the URL, domain, port, or scheduled job you want to track.
Choose how you're alerted
Connect email, Slack, Discord, or a webhook. Set cooldowns to avoid alert fatigue.
Watch the dashboard
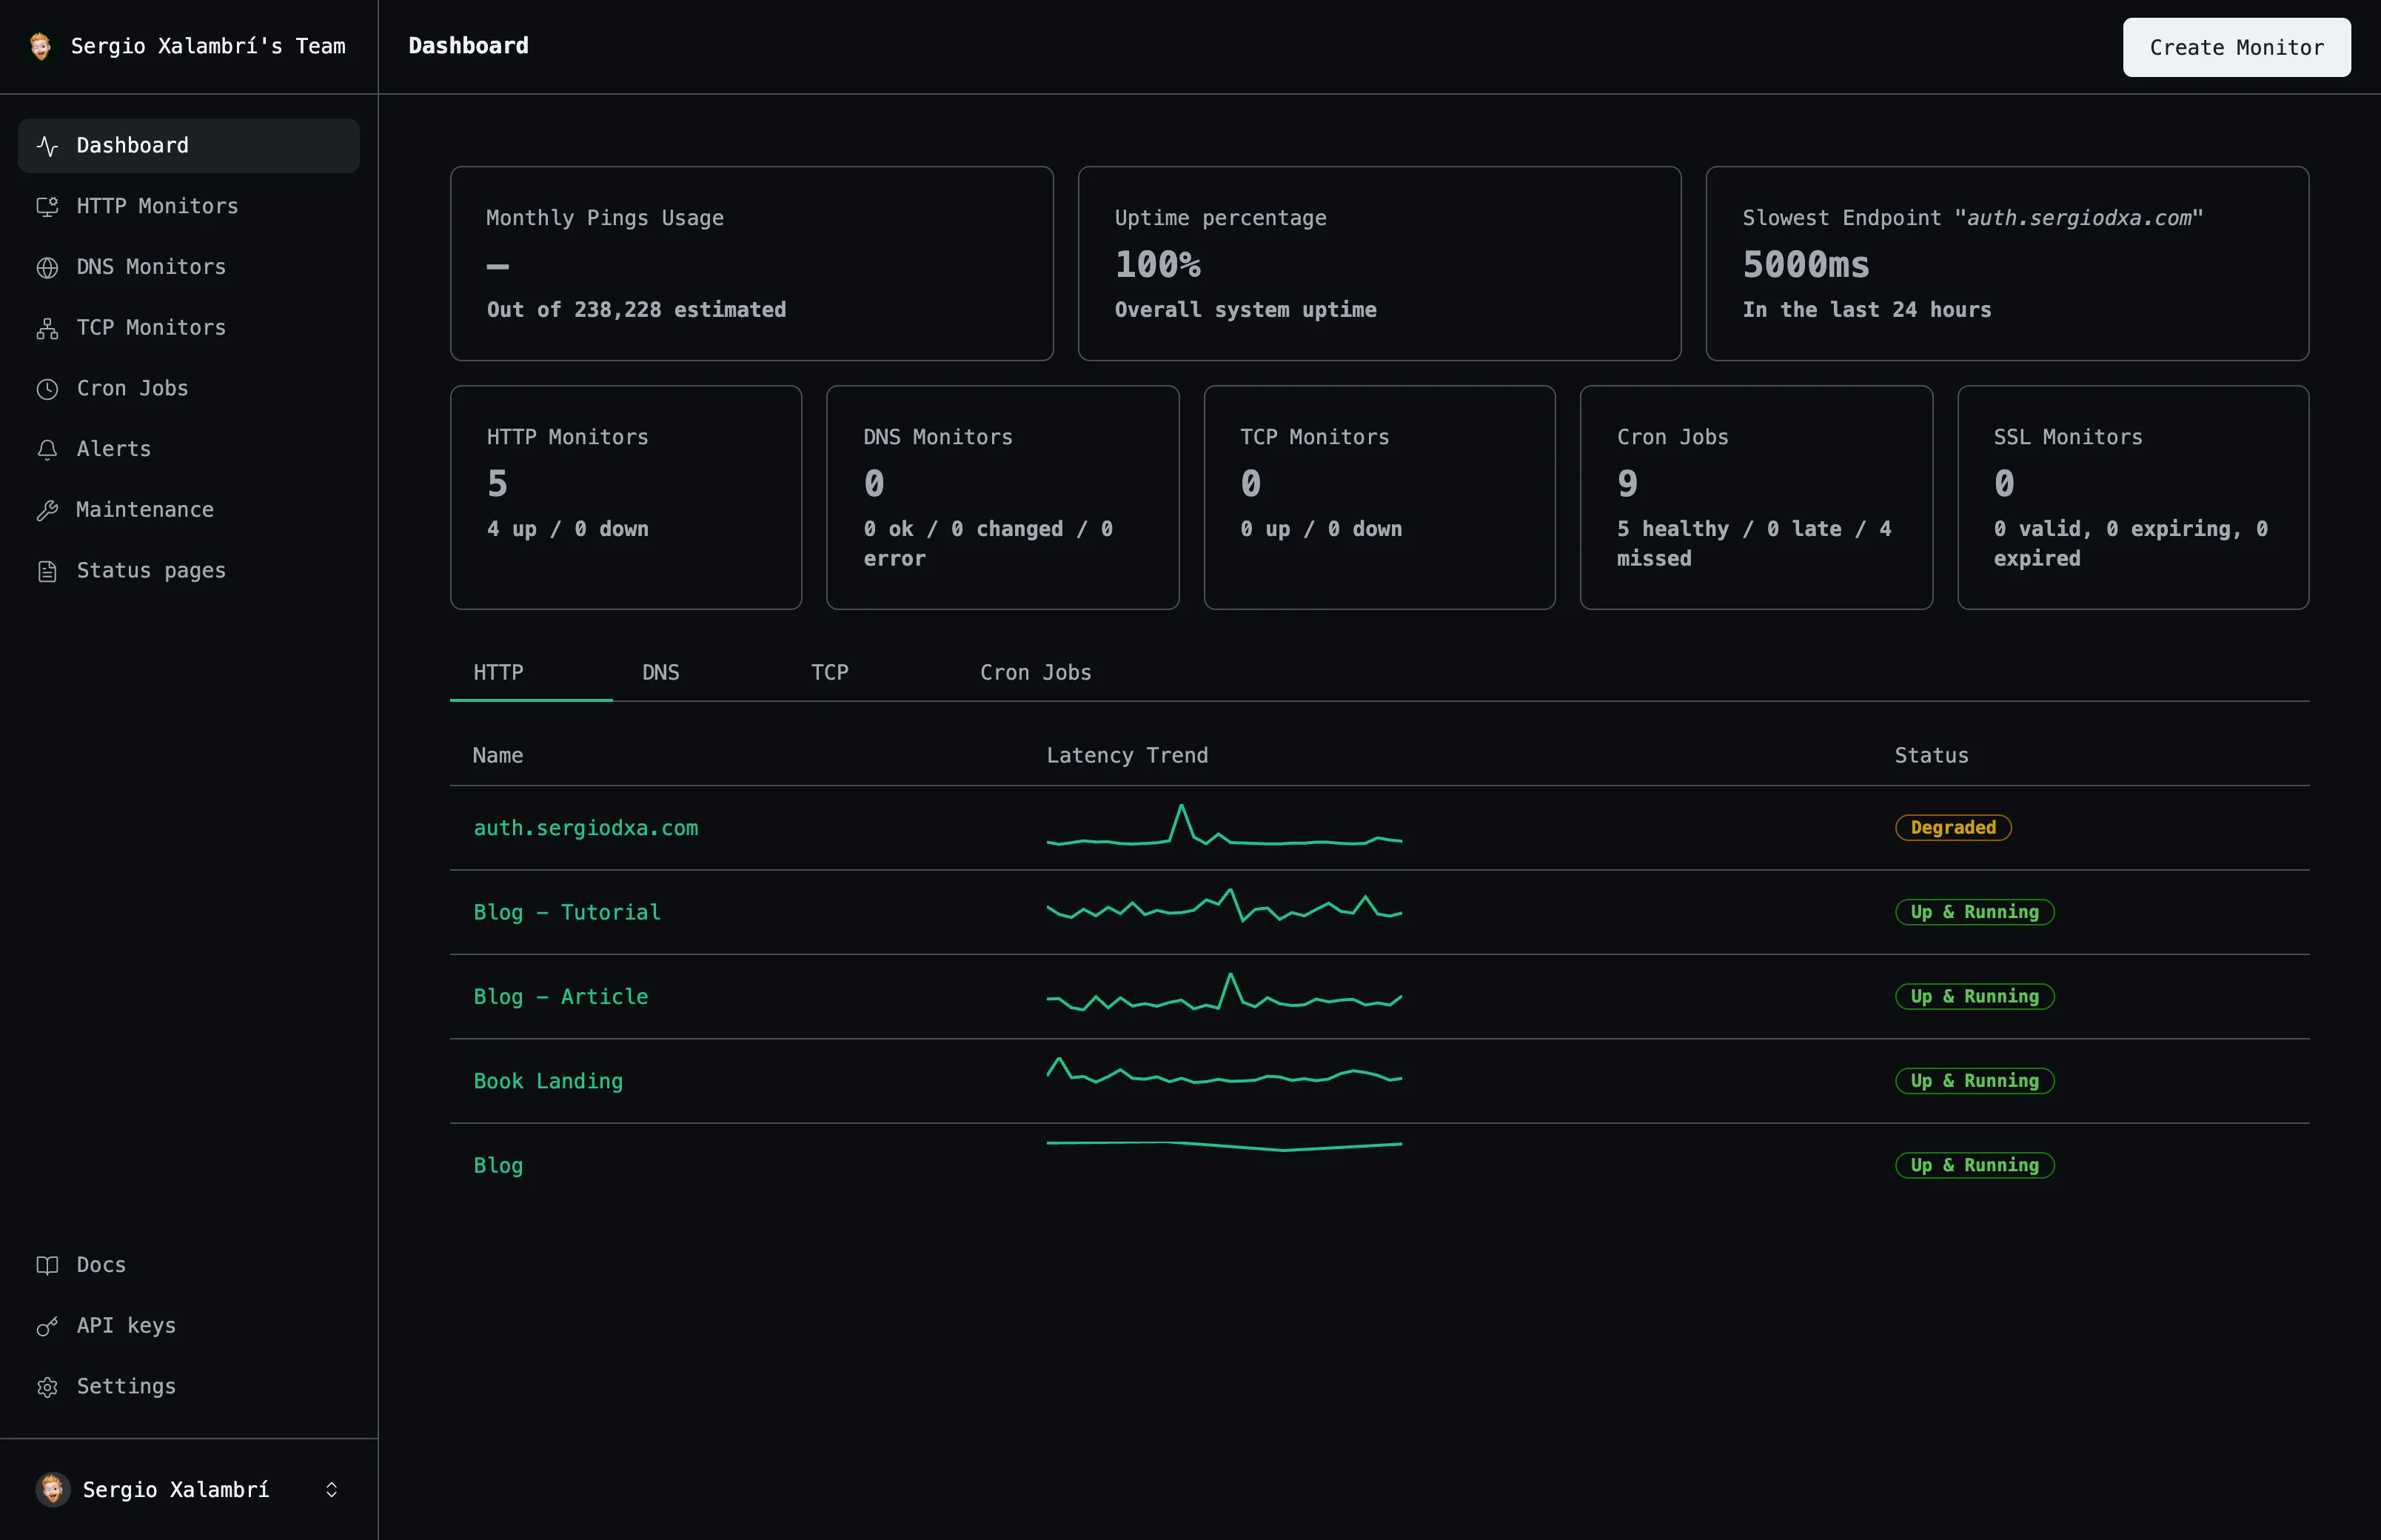
See uptime history, response times, and status update as checks run automatically.
Frequently asked questions
The questions people ask most before they start monitoring.
Can I monitor multiple pages on my site?
Yes — create a separate monitor for each URL you care about.
Will I know about a broken deploy, not just downtime?
Yes — content checks fail a monitor if expected text is missing, catching broken deploys HTTP status alone would miss.
Start monitoring your services
Create your first monitor in under 2 minutes. No credit card required to start.