Built for your existing toolchain
API-first design and webhook integrations mean Uptime fits into your deploy pipeline instead of asking you to change it.
API First
Signed Webhooks
Lock-in
& Cron Checks
Everything you need
A closer look at what you get, from the first check to the alert that reaches you.
REST API
Manage monitors, alerts, and maintenance windows programmatically.
Signed webhooks
Every webhook alert carries an HMAC signature you can verify.
TCP & cron monitoring
Watch raw ports and scheduled jobs, not just HTTP endpoints.
Maintenance windows
Suppress alerts automatically during scheduled deploys.
How it works
Three steps from an empty dashboard to checks that run on their own.
Create your monitor
Point Uptime at the URL, domain, port, or scheduled job you want to track.
Choose how you're alerted
Connect email, Slack, Discord, or a webhook. Set cooldowns to avoid alert fatigue.
Watch the dashboard
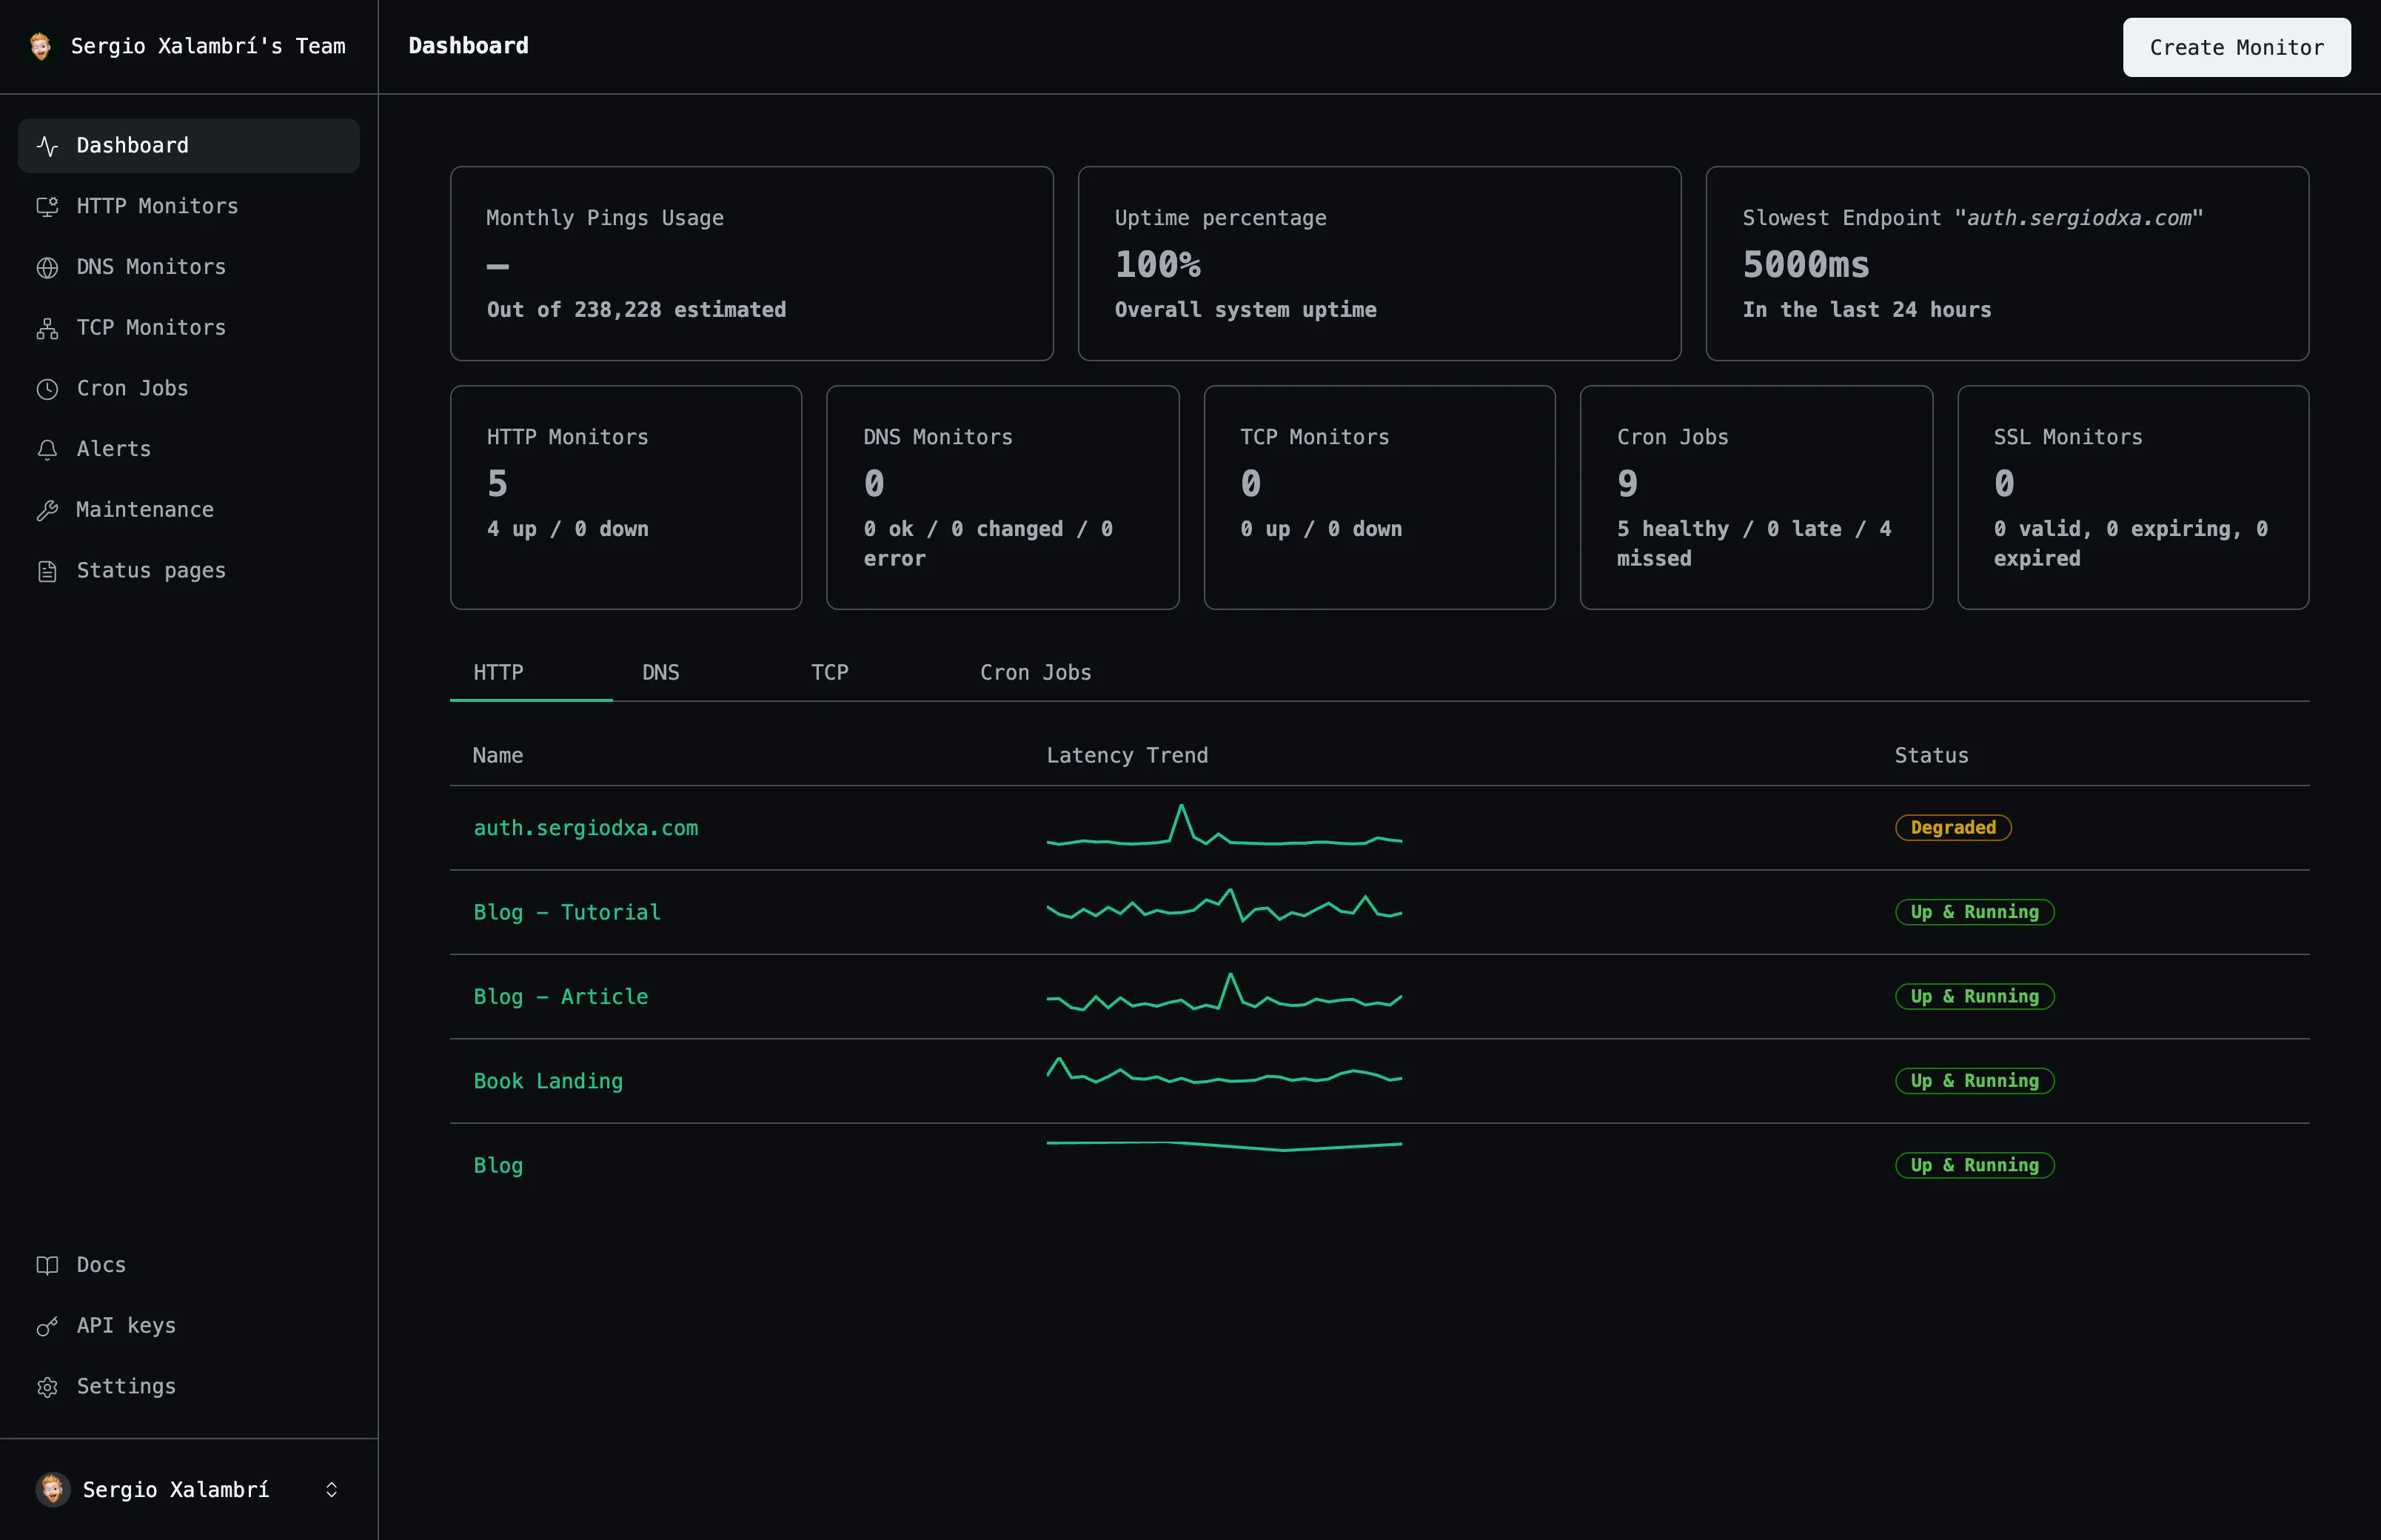
See uptime history, response times, and status update as checks run automatically.
Frequently asked questions
The questions people ask most before they start monitoring.
Can I manage monitors as code?
Yes — every action available in the dashboard is also available through the REST API.
Does a deploy trigger false alerts?
Not if you schedule a maintenance window first — alerts are suppressed for its duration.
Start monitoring your services
Create your first monitor in under 2 minutes. No credit card required to start.