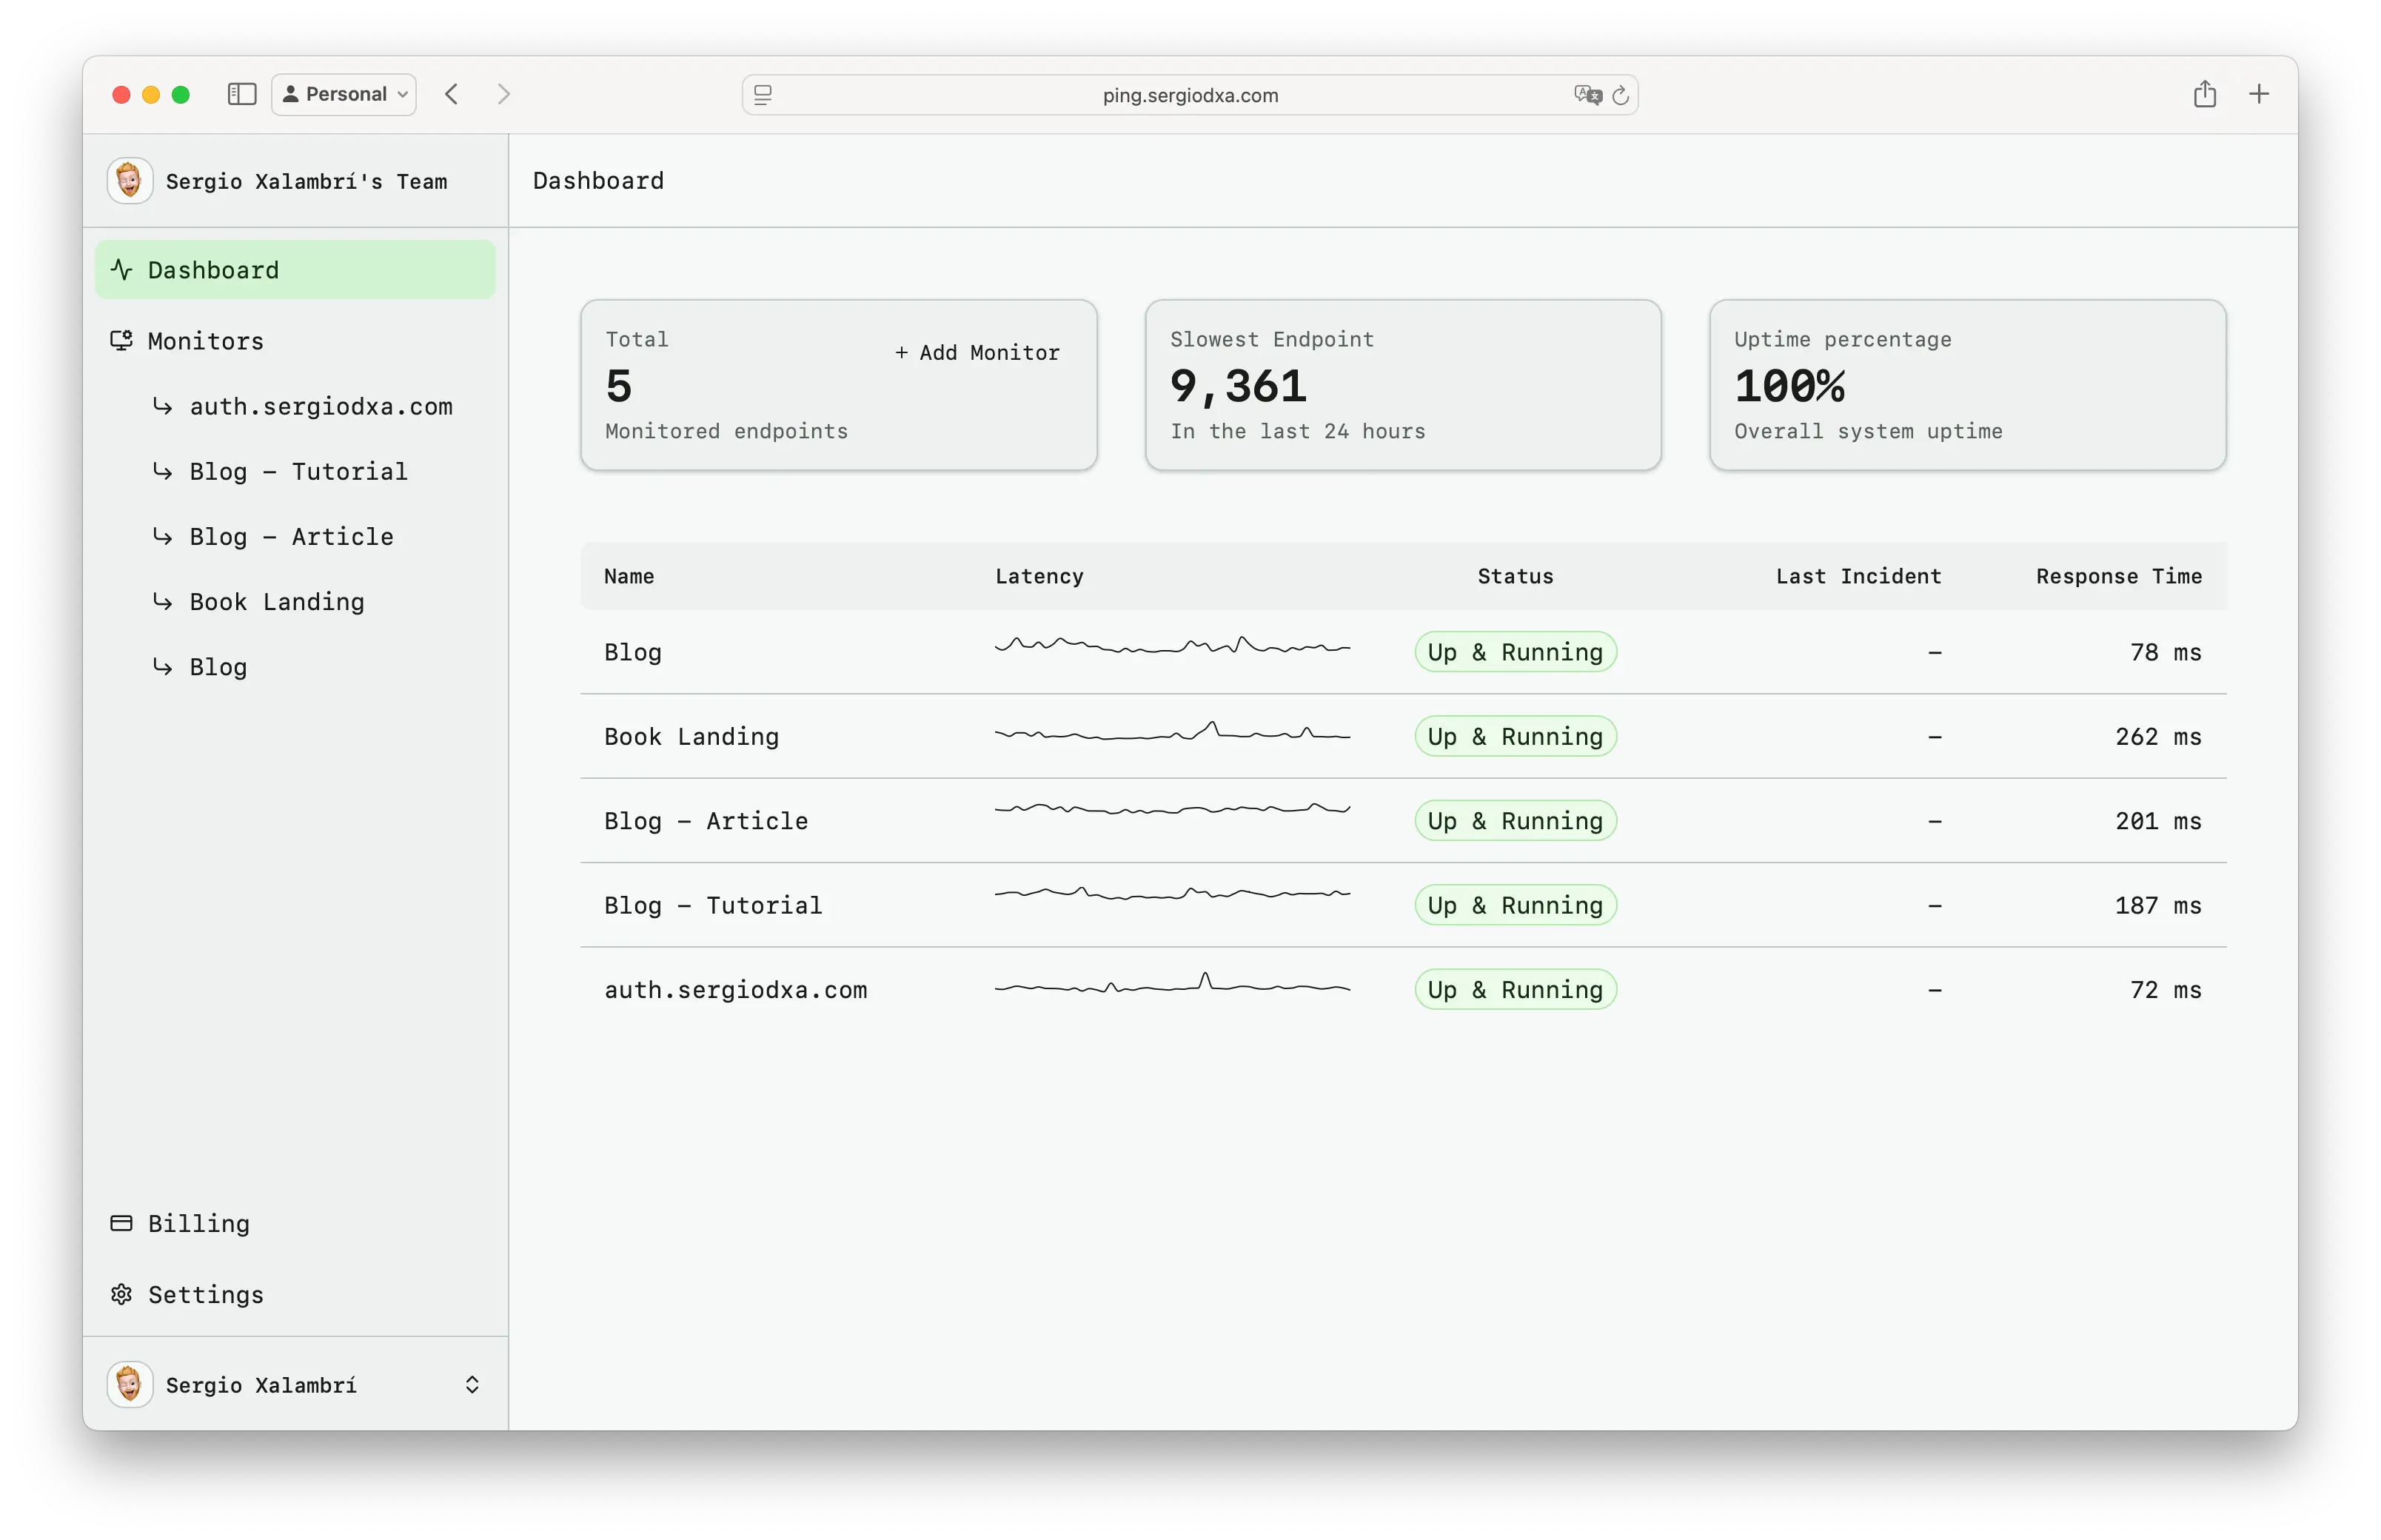
365 days of uptime insights
Visual heatmaps, response time trends, and detailed historical data to understand your service reliability.

Days Retention
Heatmaps
Response Time
Analysis
Everything you need to analyze your uptime
Comprehensive analytics to understand and improve your service reliability.
Visual heatmaps
See daily success rates at a glance. Green for up, red for down, yellow for mixed.
365-day history
A full year of data retention. Review past incidents and track improvement.
Response time tracking
Monitor P99 response times. Identify slow endpoints before they become problems.
Uptime percentage
Calculate overall uptime across all monitors or individually.
Incident timeline
See when outages occurred and how long they lasted.
Latency trends
Track response time changes over time with visual charts.
How analytics works
Understand your service reliability with powerful insights.
Monitor your services
Every health check is recorded with timestamp and response time.
View your dashboard
Heatmaps and stats update in real-time as checks complete.
Analyze trends
Review historical data to identify patterns and improvements.
Frequently asked questions
Common questions about analytics and data retention.
Understand your service reliability
Get actionable insights from 365 days of monitoring data.
Start Monitoring