Monitoring that scales with your team
Team collaboration, instant alerts, and usage-based pricing that scales with you as your product — and your on-call rotation — grows.
Team Members
Min Interval
Uptime Target
Regions
Everything you need
A closer look at what you get, from the first check to the alert that reaches you.
Grow your team
Invite engineers as you hire, with no per-seat pricing.
Role-based access
Owners and Admins manage settings; Members focus on monitoring.
Status pages
Give customers a public status page as trust becomes a selling point.
API access
Wire monitoring into your deploy pipeline as your infra matures.
How it works
Three steps from an empty dashboard to checks that run on their own.
Create your monitor
Point Uptime at the URL, domain, port, or scheduled job you want to track.
Choose how you're alerted
Connect email, Slack, Discord, or a webhook. Set cooldowns to avoid alert fatigue.
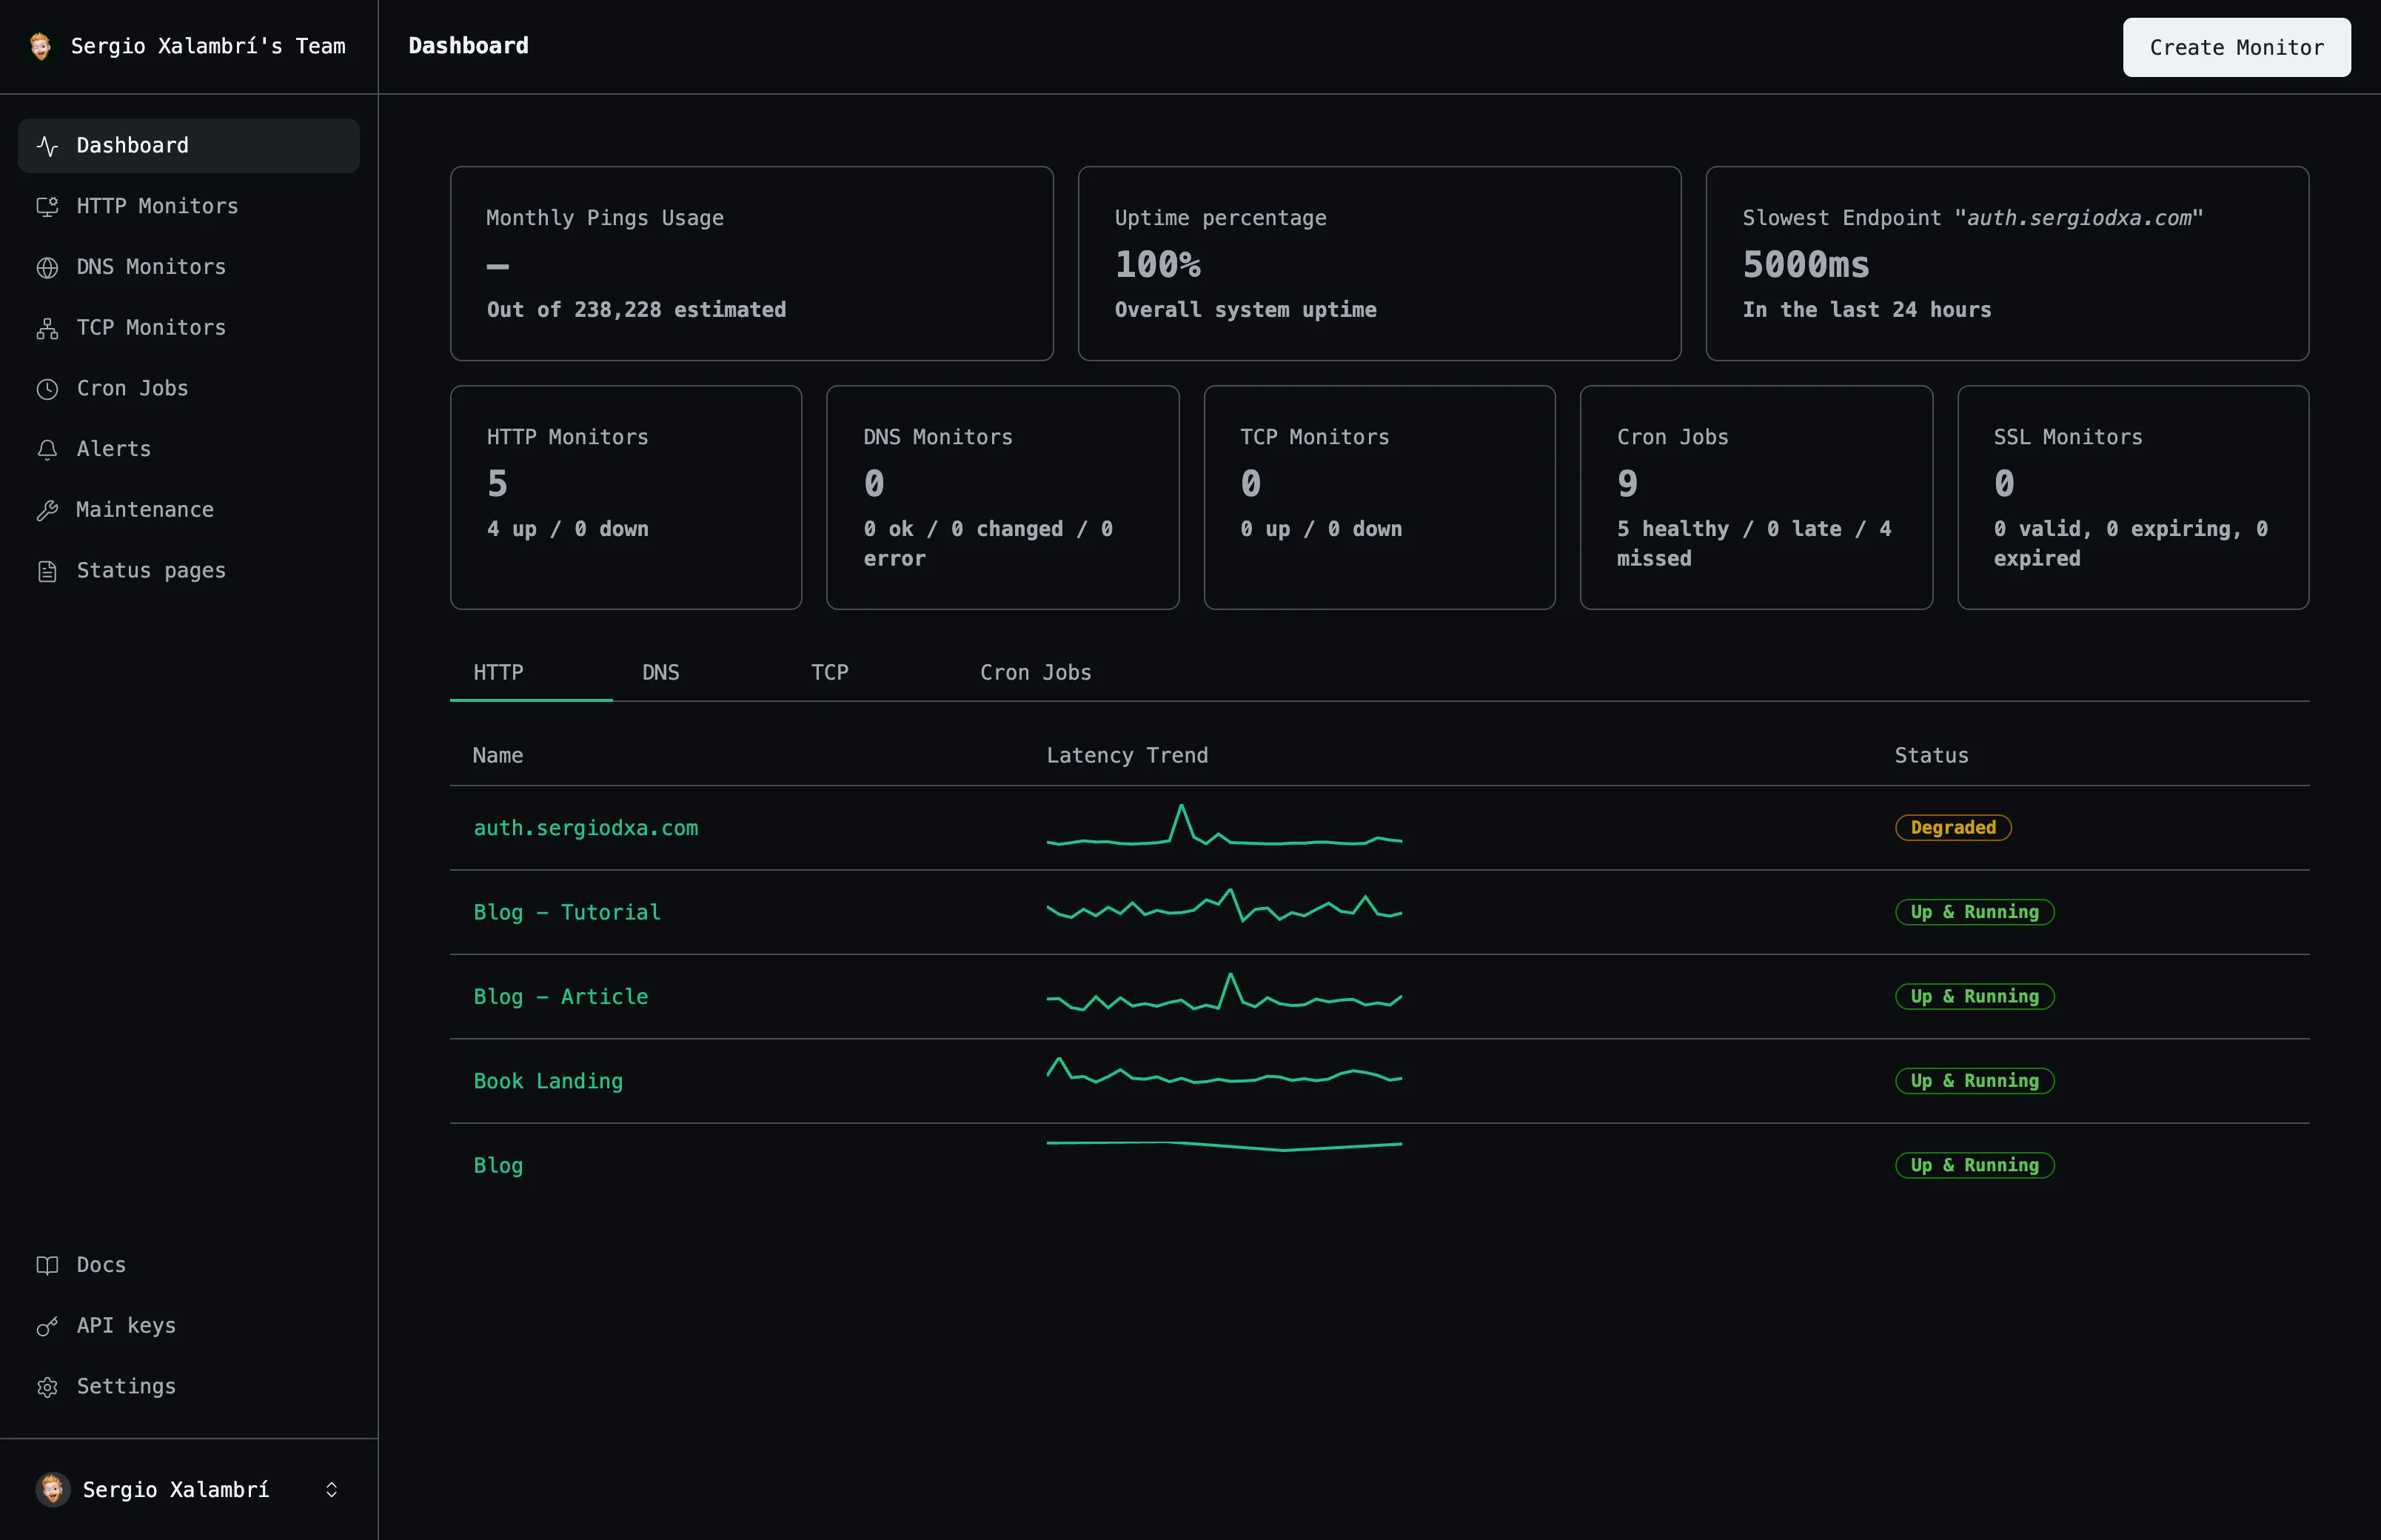
Watch the dashboard
See uptime history, response times, and status update as checks run automatically.
Frequently asked questions
The questions people ask most before they start monitoring.
Does pricing scale with team size?
No — pricing is based on monitoring usage (pings), not the number of team members.
Can we add a public status page later?
Yes, at any time, with any subset of your monitors attached.
Start monitoring your services
Create your first monitor in under 2 minutes. No credit card required to start.