Know your scheduled jobs actually ran
Monitor scheduled tasks and cron jobs. Get alerts when jobs are late, miss their window, or fail to complete.
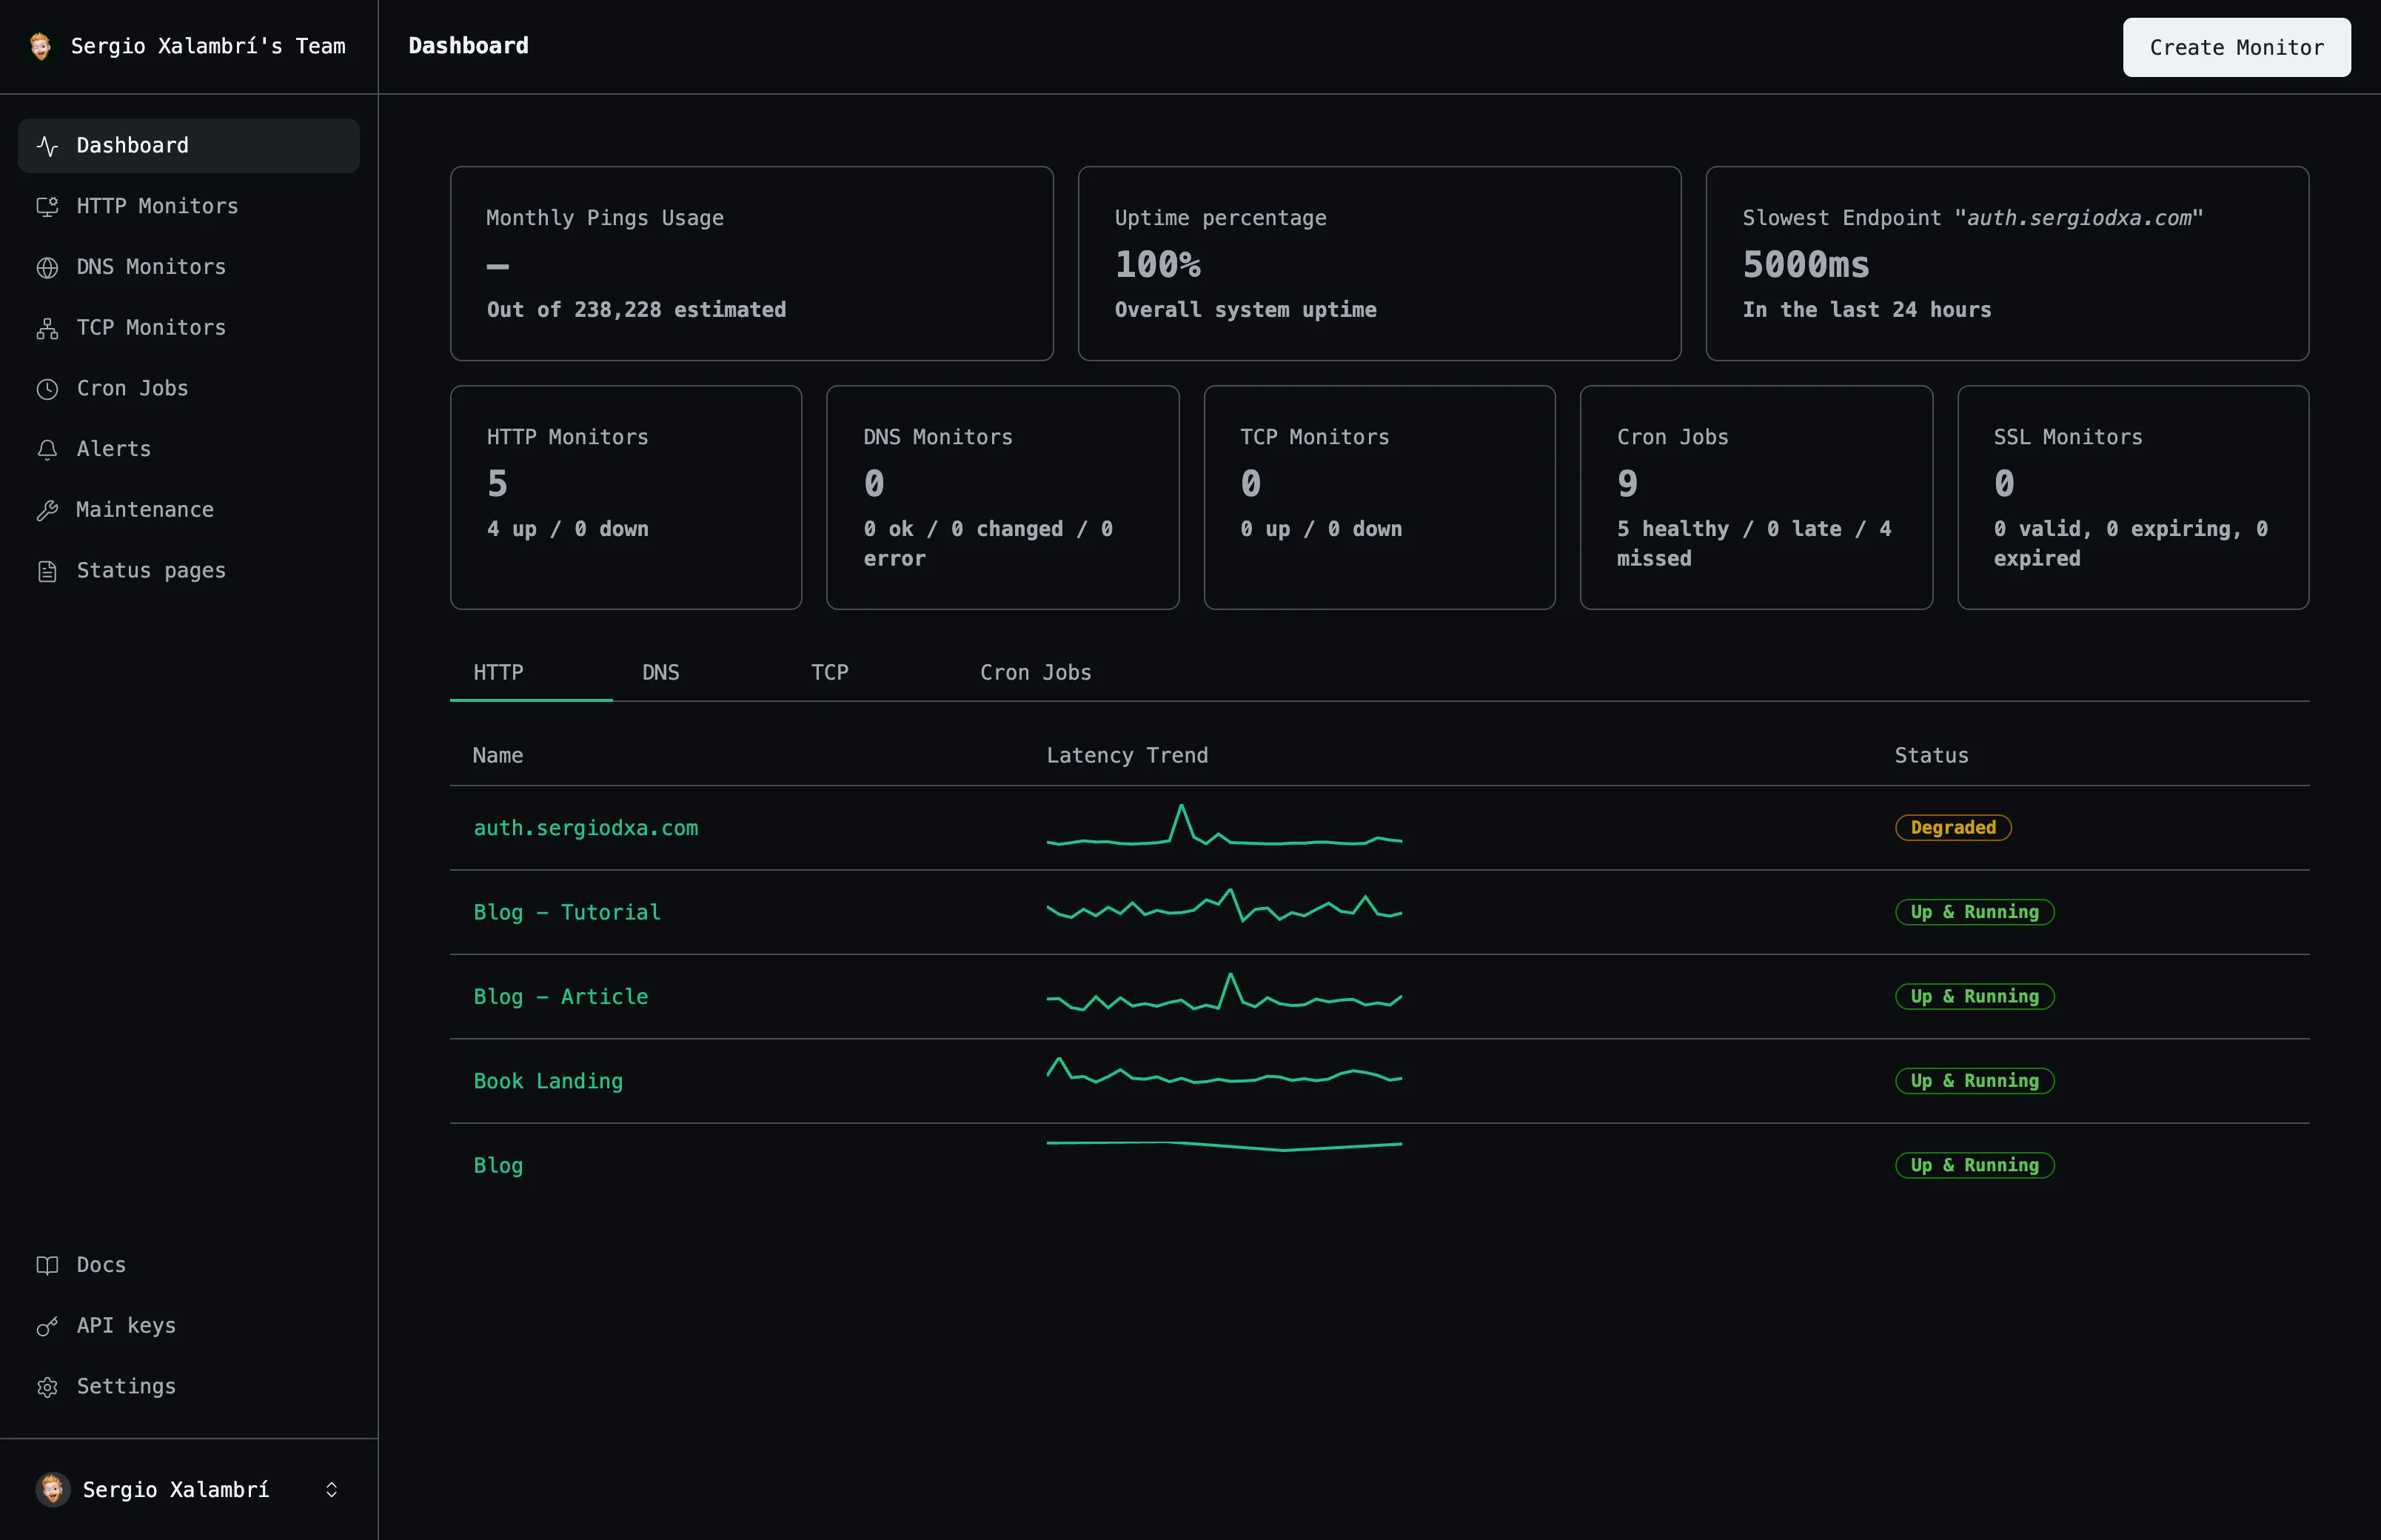
Detection Time
Monitoring
Days Retention
Uptime Target
Everything you need
A closer look at what you get, from the first check to the alert that reaches you.
Cron-aware scheduling
Uptime parses your cron expression to know exactly when to expect a ping.
Public ping endpoint
One line in your job reports completion — no API key needed.
Grace periods
Absorb normal timing variance before a job is marked late.
Status pages
Show scheduled job health alongside your other services.
How it works
Three steps from an empty dashboard to checks that run on their own.
Create a cron job monitor
Enter its schedule as a standard cron expression.
Add the ping call
One line in your job pings the monitor's URL on completion.
Get alerted when it's late
Missed or late pings trigger an alert automatically.
Frequently asked questions
The questions people ask most before they start monitoring.
What counts as 'late' vs 'missed'?
A grace period after the expected run time marks the job late; missing that window too marks it missed.
Do I need to authenticate the ping request?
No — the ping endpoint is public and rate-limited by design, so any job can report in with one line.
Start monitoring your services
Create your first monitor in under 2 minutes. No credit card required to start.