Know a client site is down before they call you
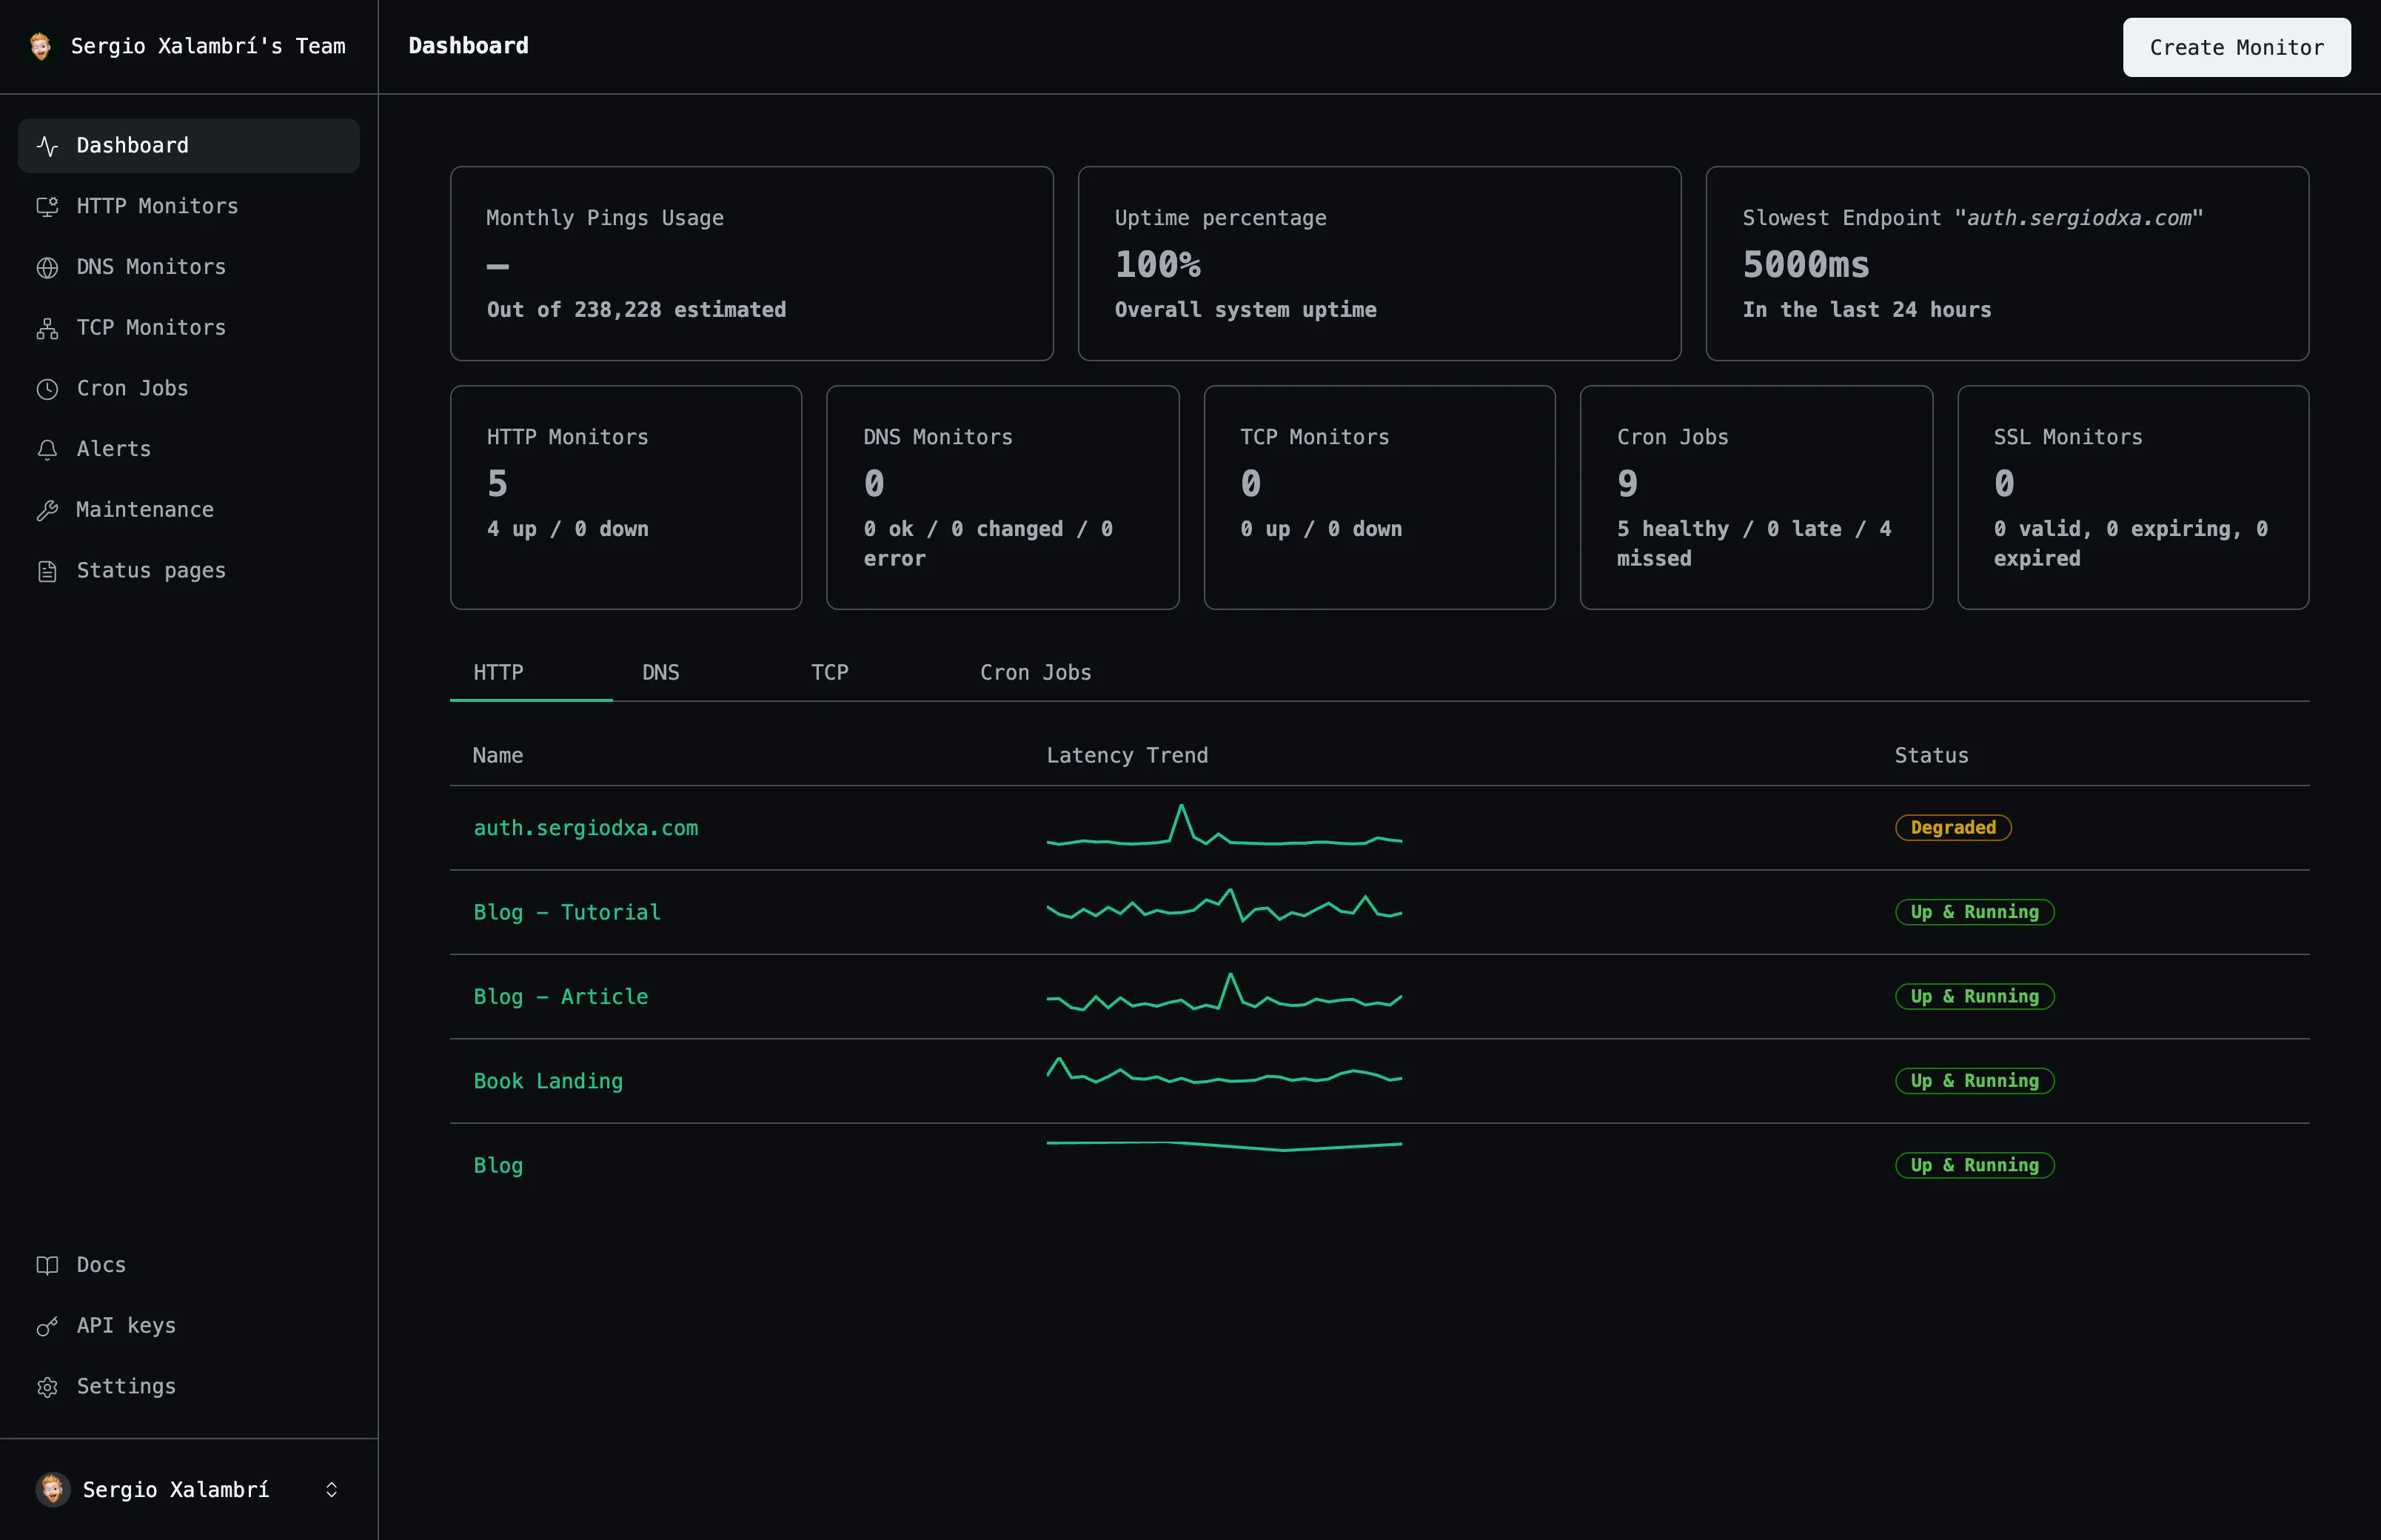
Monitor client websites, APIs, SSL certificates, DNS records, ports and scheduled jobs from one dashboard. Unlimited monitors and unlimited team members, from $5/month.
Monitors & Members
Monitor Types
Regions
Base Price
Everything you need
A closer look at what you get, from the first check to the alert that reaches you.
Find out before the client does
The call you don't want is the client telling you their site is down. Checks run as often as every minute and the alert goes to you first.
No monitor math
Unlimited monitors and unlimited team members. Add a client, add their staging site, add the whole team — the price doesn't move because you added rows.
Certificates you'd otherwise forget
An expired certificate takes a client's site down as effectively as an outage, on a date nobody has in a calendar. SSL expiry is watched per site and warned on ahead of time.
DNS you didn't change
Records get edited at the registrar by someone who isn't you. DNS monitors tell you what changed and when.
The jobs nobody watches
Backups, imports, and nightly syncs fail silently. A cron monitor expects a ping on a schedule and tells you when one doesn't arrive.
A status page per client
Point a client at their own status page instead of answering the same question by email. Each one shows only that client's monitors.
How it works
Three steps from an empty dashboard to checks that run on their own.
Watch one client site free for 7 days
Give us a URL and an email. We check it hourly for a week and send you a health report at the end — no account and no card.
Bring the rest of the roster over
Sign up and the site you were already watching becomes a real monitor, with the week it has behind it. Add the others at whatever interval each one deserves.
Point alerts where you already work
Email, Slack, Discord, or a webhook, with cooldowns so a flapping site doesn't bury the rest of the roster.
Frequently asked questions
The questions people ask most before they start monitoring.
How does pricing work if I have thirty client sites?
You're billed for checks, not for sites. $5/month includes 100,000 checks, and usage past that is $1 per 10,000 checks in whole blocks. Thirty sites checked every fifteen minutes is about 80,640 checks a month, so what you pay depends on how often you check rather than on how many clients you have.
Do I pay per team member?
No. Invite everyone who might pick up an incident — members are unlimited and don't affect the price.
Can I give each client their own status page?
Yes — create one status page per client and attach only that client's monitors.
Can I monitor client domains I don't own?
You need authorization to monitor any endpoint you don't own — see the Terms of Service.
What happens to the free week if I sign up partway through?
It carries over. The site becomes a monitor on your account with the checks it has already run behind it, so you don't set it up twice or start the graph from zero.
Start monitoring your services
Create your first monitor in under 2 minutes. No credit card required to start.