Automate your health checks
Automated health checks for your services. Monitor endpoints, databases, and internal services with customizable intervals.
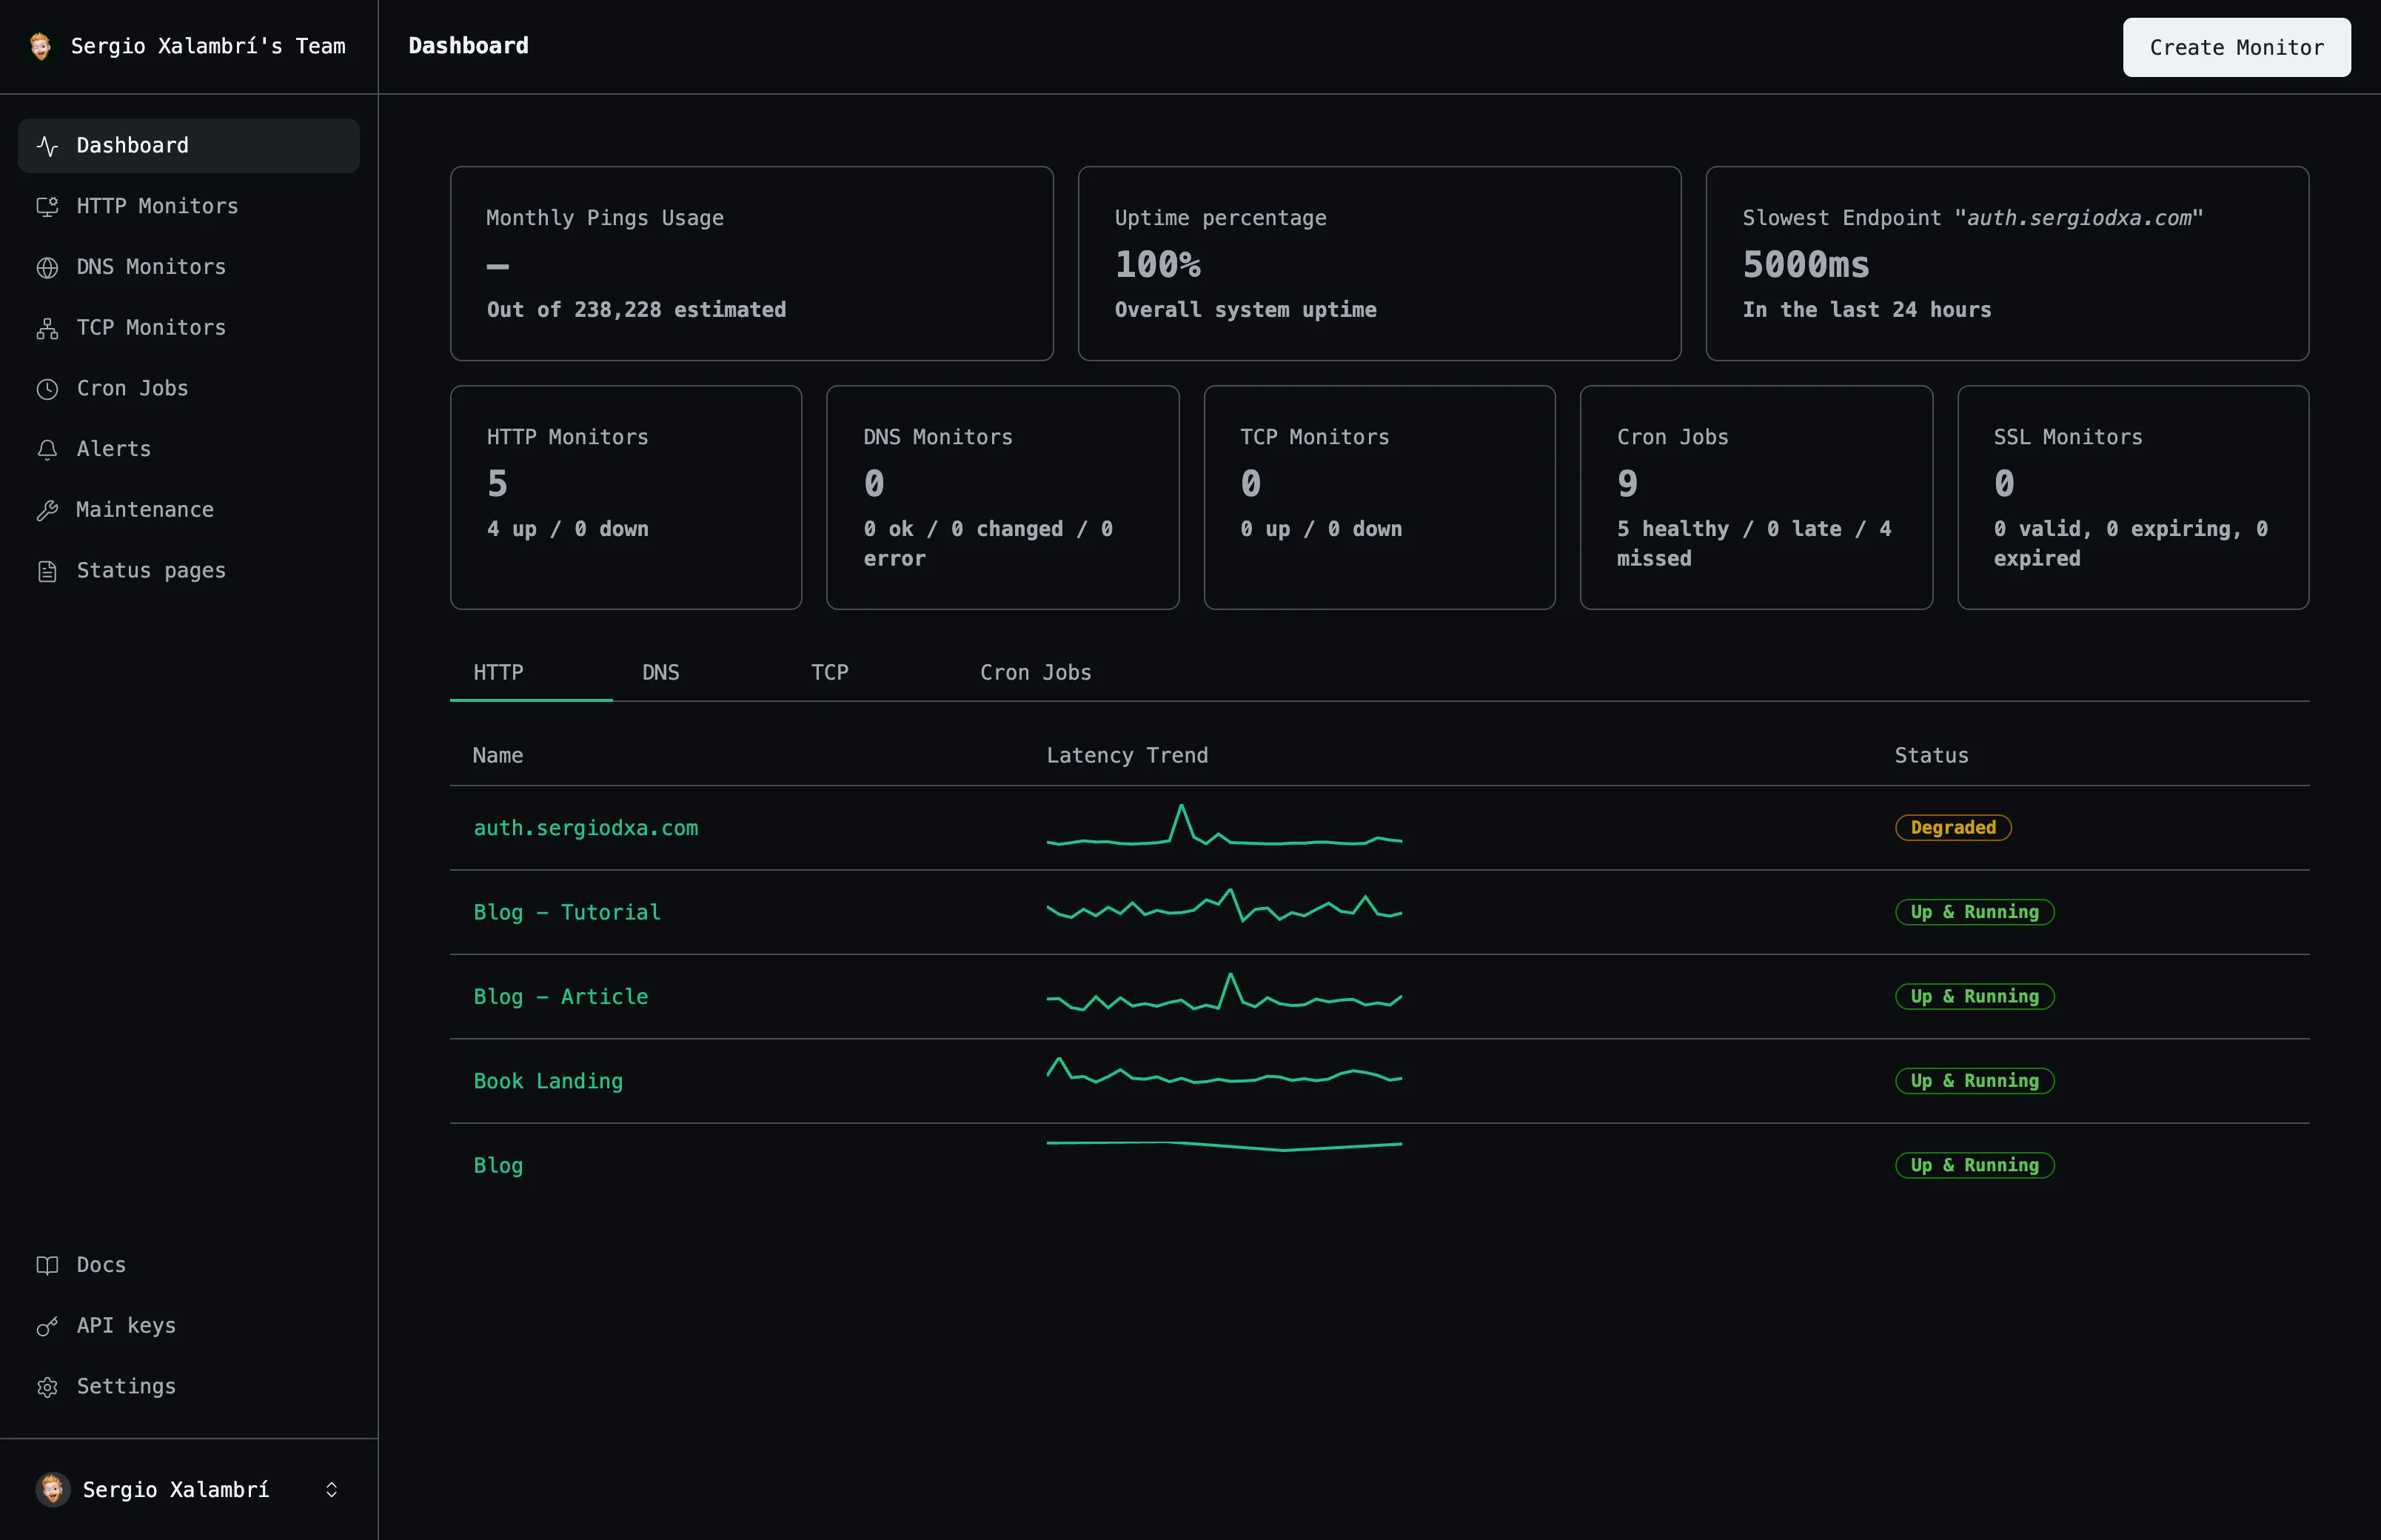
Endpoints
Intervals
Trigger
Alerts
Everything you need
A closer look at what you get, from the first check to the alert that reaches you.
Dedicated health endpoints
Point a monitor at any `/healthz`-style route.
Flexible intervals
Check as often as every minute, or as rarely as every hour.
Manual trigger
Run any health check instantly to verify after a deploy.
Recovery alerts
Know the moment a service comes back healthy, not just when it fails.
How it works
Three steps from an empty dashboard to checks that run on their own.
Create your monitor
Point Uptime at the URL, domain, port, or scheduled job you want to track.
Choose how you're alerted
Connect email, Slack, Discord, or a webhook. Set cooldowns to avoid alert fatigue.
Watch the dashboard
See uptime history, response times, and status update as checks run automatically.
Frequently asked questions
The questions people ask most before they start monitoring.
Can I monitor internal services?
Yes, as long as the service is reachable from the internet; add custom headers to authenticate requests.
Can I test a monitor right after creating it?
Yes — a check runs automatically right after you create a monitor.
Start monitoring your services
Create your first monitor in under 2 minutes. No credit card required to start.