Keep your users informed without the support tickets
Beautiful, customizable public status pages with real-time status, uptime history, and your own branding.
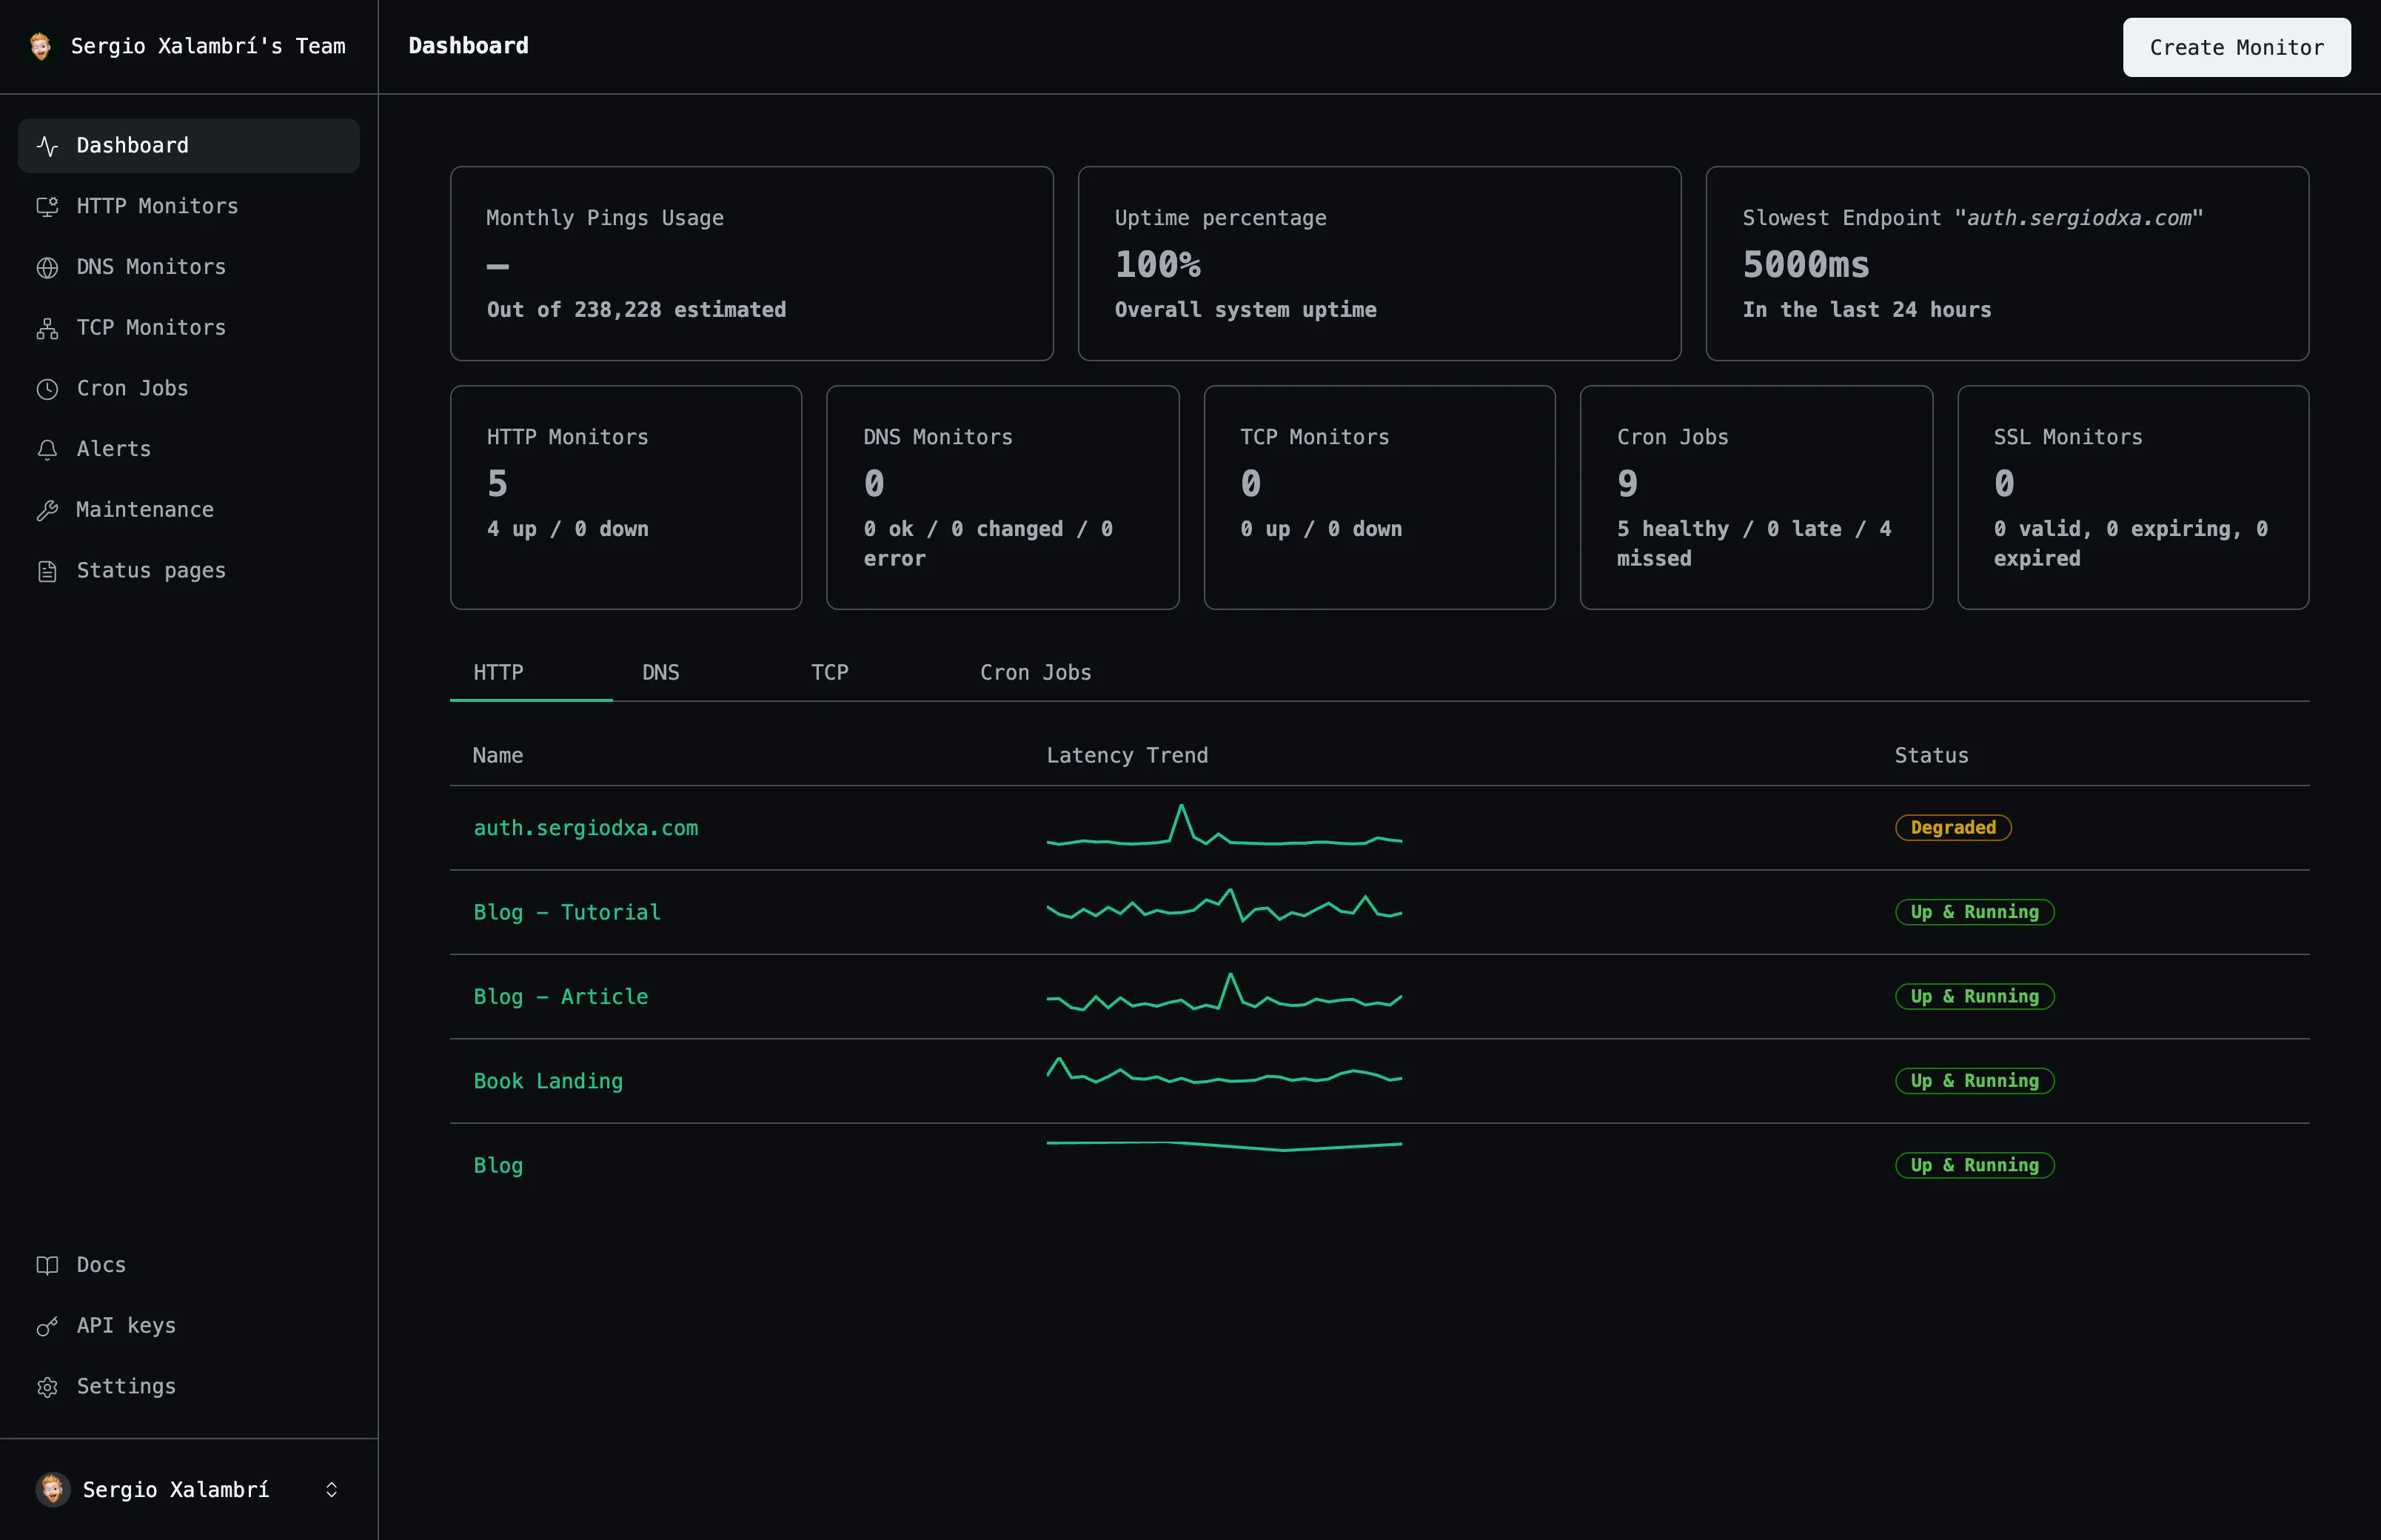
Status Pages
Branding
Updates
Visibility
Everything you need
A closer look at what you get, from the first check to the alert that reaches you.
Overall status banner
A single glance shows operational, degraded, or down.
Any monitor type
Attach HTTP, DNS, TCP, and cron-job monitors to the same page.
Your branding
Add a logo, title, and description that match your product.
Uptime history
Each service shows its last 90 days of daily uptime so visitors can see recent reliability.
Public or private
Publish pages for customers, or keep them private for internal use only.
How it works
Three steps from an empty dashboard to checks that run on their own.
Create a status page
Pick a URL slug, title, and optional logo.
Attach your services
Select which monitors and cron jobs to display.
Share the link
Publish the page and share it with your users.
Frequently asked questions
The questions people ask most before they start monitoring.
Do you support status pages?
Yes — create customizable public status pages to share your service health, with your own branding.
Can I include cron job monitors on a status page?
Yes, alongside HTTP, DNS, and TCP monitors, each shown with its own status and history.
Can I keep a status page private?
Yes — private pages have no public URL and are for internal visibility only.
Does the status page update automatically?
Yes, it reflects each attached monitor's latest status and recent uptime history.
Start monitoring your services
Create your first monitor in under 2 minutes. No credit card required to start.