Keep your SaaS product reliable
Comprehensive monitoring for SaaS products: track APIs, dashboards, and background jobs in one platform.
Endpoint
Facing
Uptime Target
With You
Everything you need
A closer look at what you get, from the first check to the alert that reaches you.
Full-stack coverage
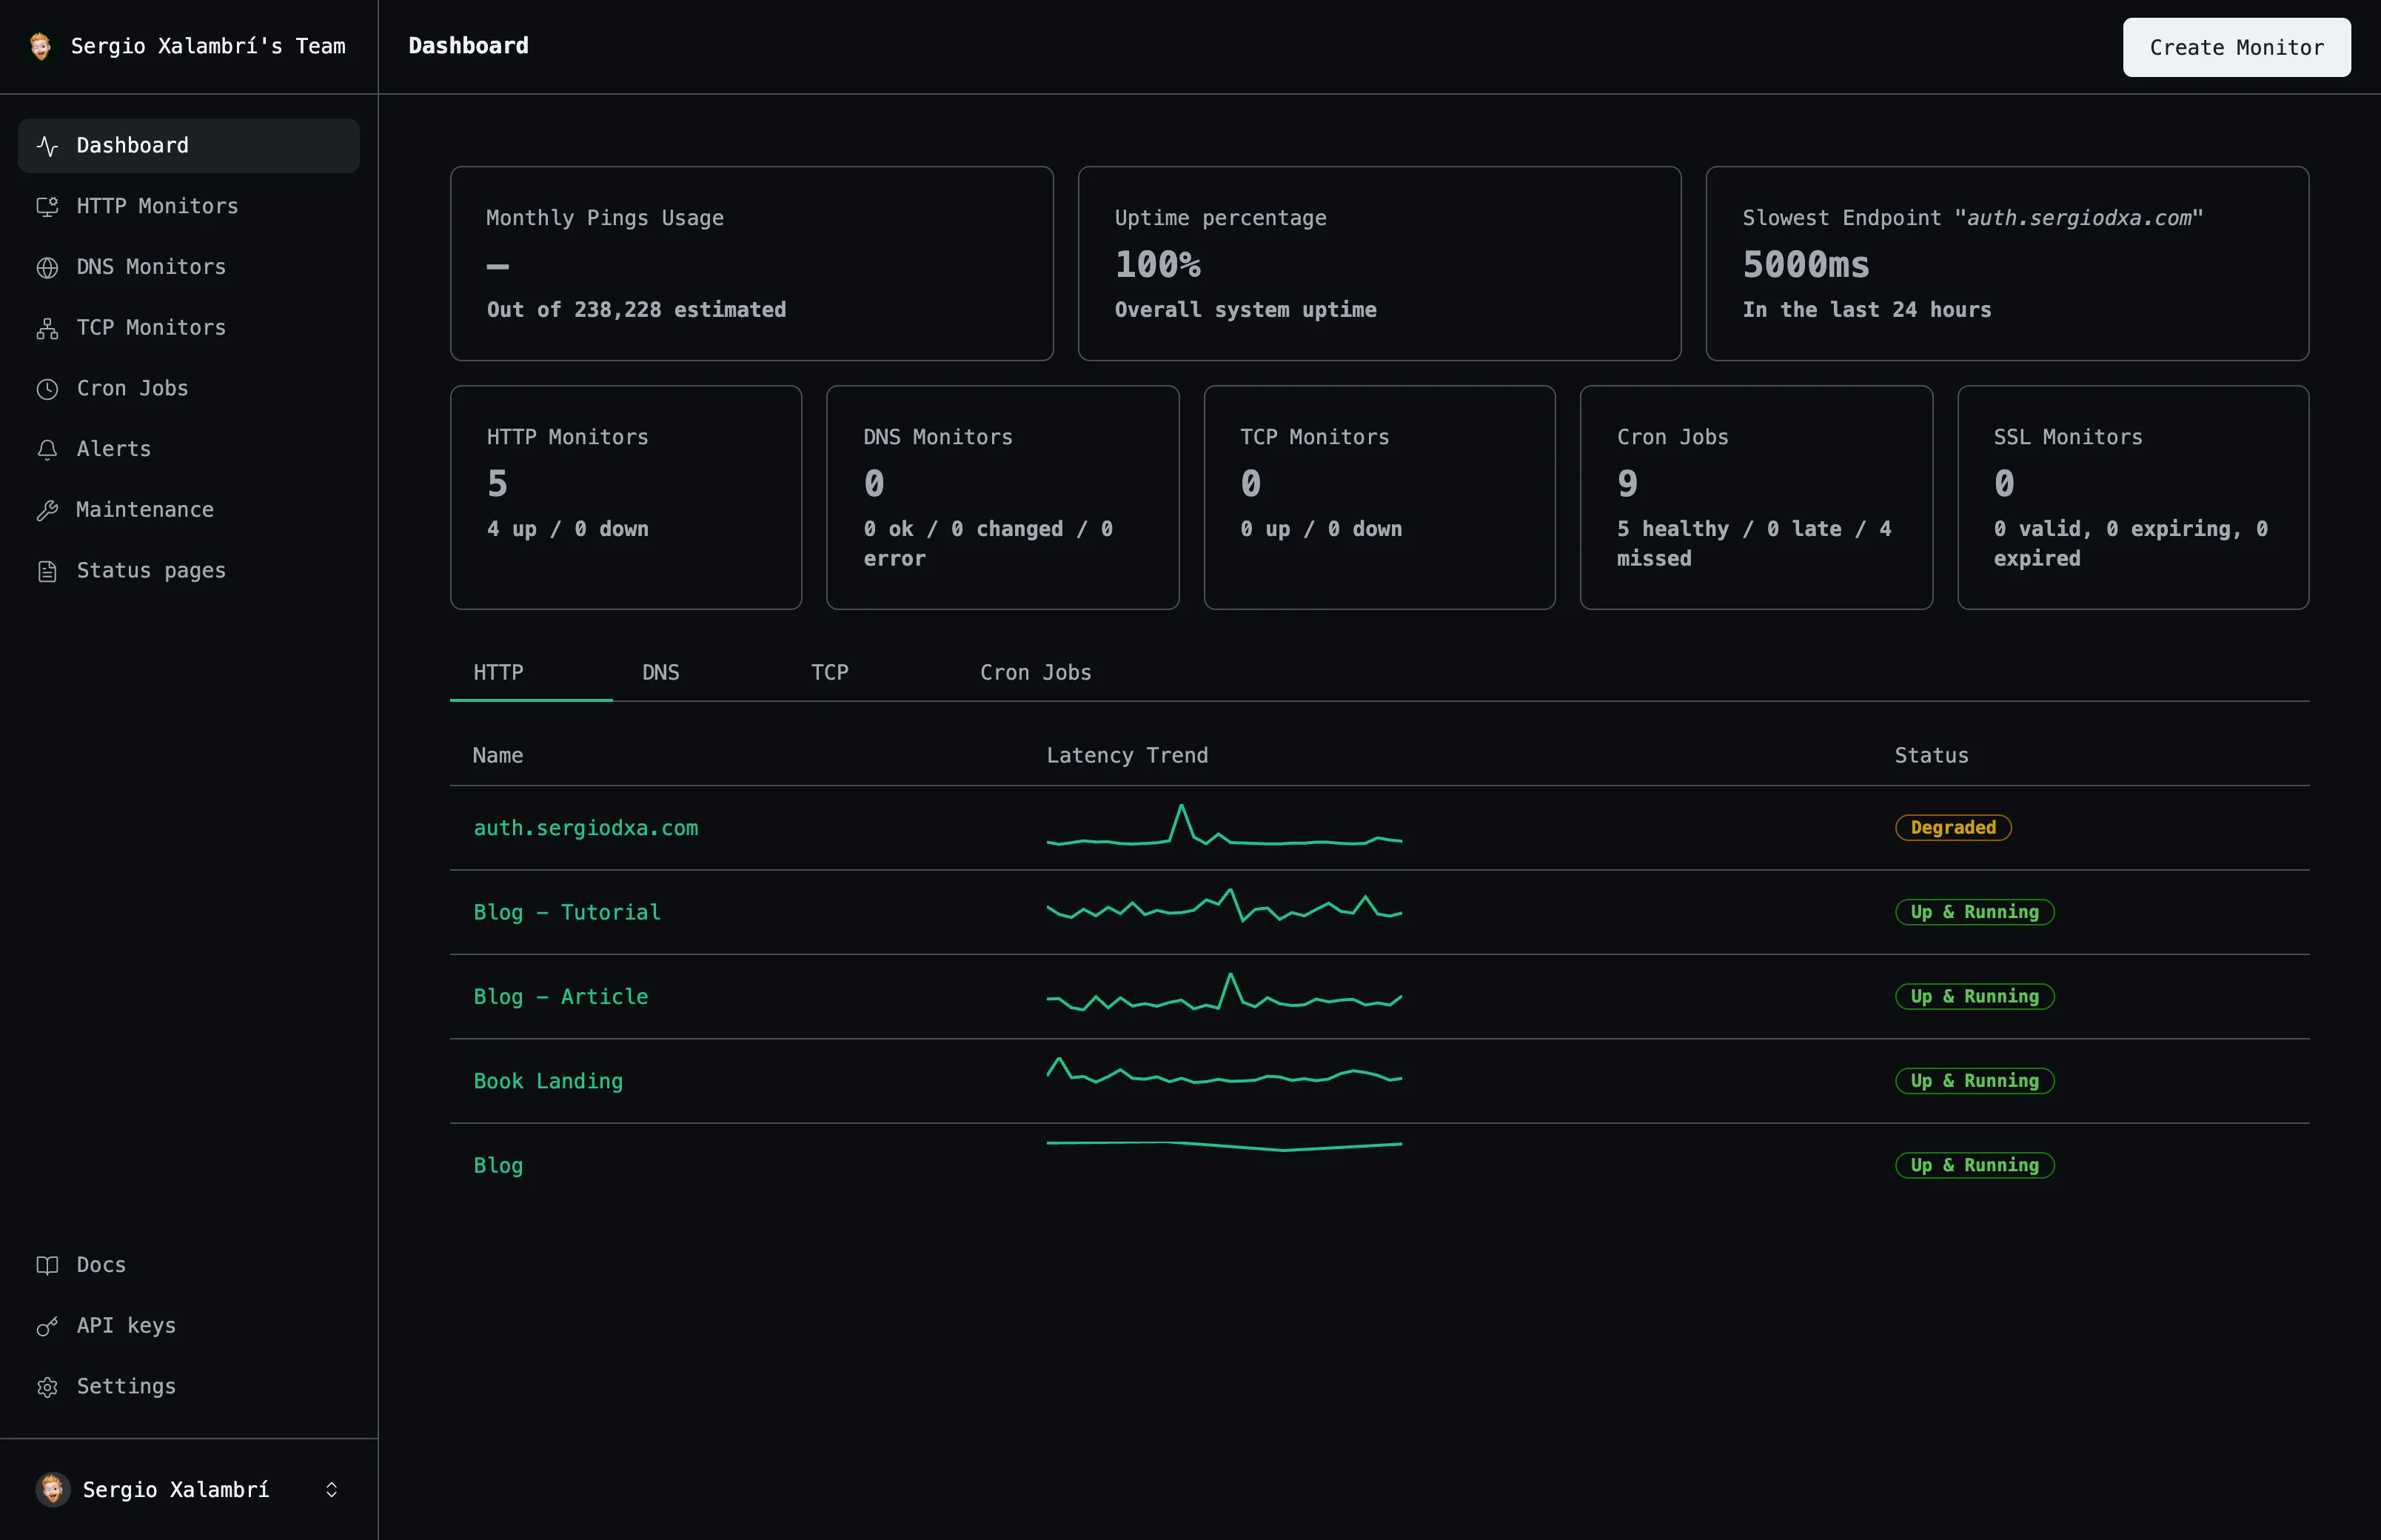
Monitor your marketing site, app, API, and background jobs together.
Team collaboration
Invite your whole engineering team with role-based access.
Customer-facing status page
Turn reliability into a trust signal for your customers.
Alert routing
Route critical API alerts to on-call, and lower-priority ones elsewhere.
How it works
Three steps from an empty dashboard to checks that run on their own.
Create your monitor
Point Uptime at the URL, domain, port, or scheduled job you want to track.
Choose how you're alerted
Connect email, Slack, Discord, or a webhook. Set cooldowns to avoid alert fatigue.
Watch the dashboard
See uptime history, response times, and status update as checks run automatically.
Frequently asked questions
The questions people ask most before they start monitoring.
Can I monitor my background workers, not just the web app?
Yes — cron-job monitoring covers scheduled workers and background jobs alongside HTTP checks.
Can customers see our uptime history?
Only if you choose to — status pages can be public or kept private.
Start monitoring your services
Create your first monitor in under 2 minutes. No credit card required to start.