Verify your API actually works
Monitor REST APIs and endpoints with detailed status checks. Track response codes, measure latency, and verify API health.
& GraphQL
Regions
Latency
Headers
Everything you need
A closer look at what you get, from the first check to the alert that reaches you.
Authenticated checks
Add Authorization headers to monitor endpoints behind auth.
Status code validation
Expect the exact status code your API should return.
Latency tracking
Watch P99 response time to catch slow-but-not-down degradation.
Content checks
Verify the response body contains an expected field or value.
How it works
Three steps from an empty dashboard to checks that run on their own.
Create your monitor
Point Uptime at the URL, domain, port, or scheduled job you want to track.
Choose how you're alerted
Connect email, Slack, Discord, or a webhook. Set cooldowns to avoid alert fatigue.
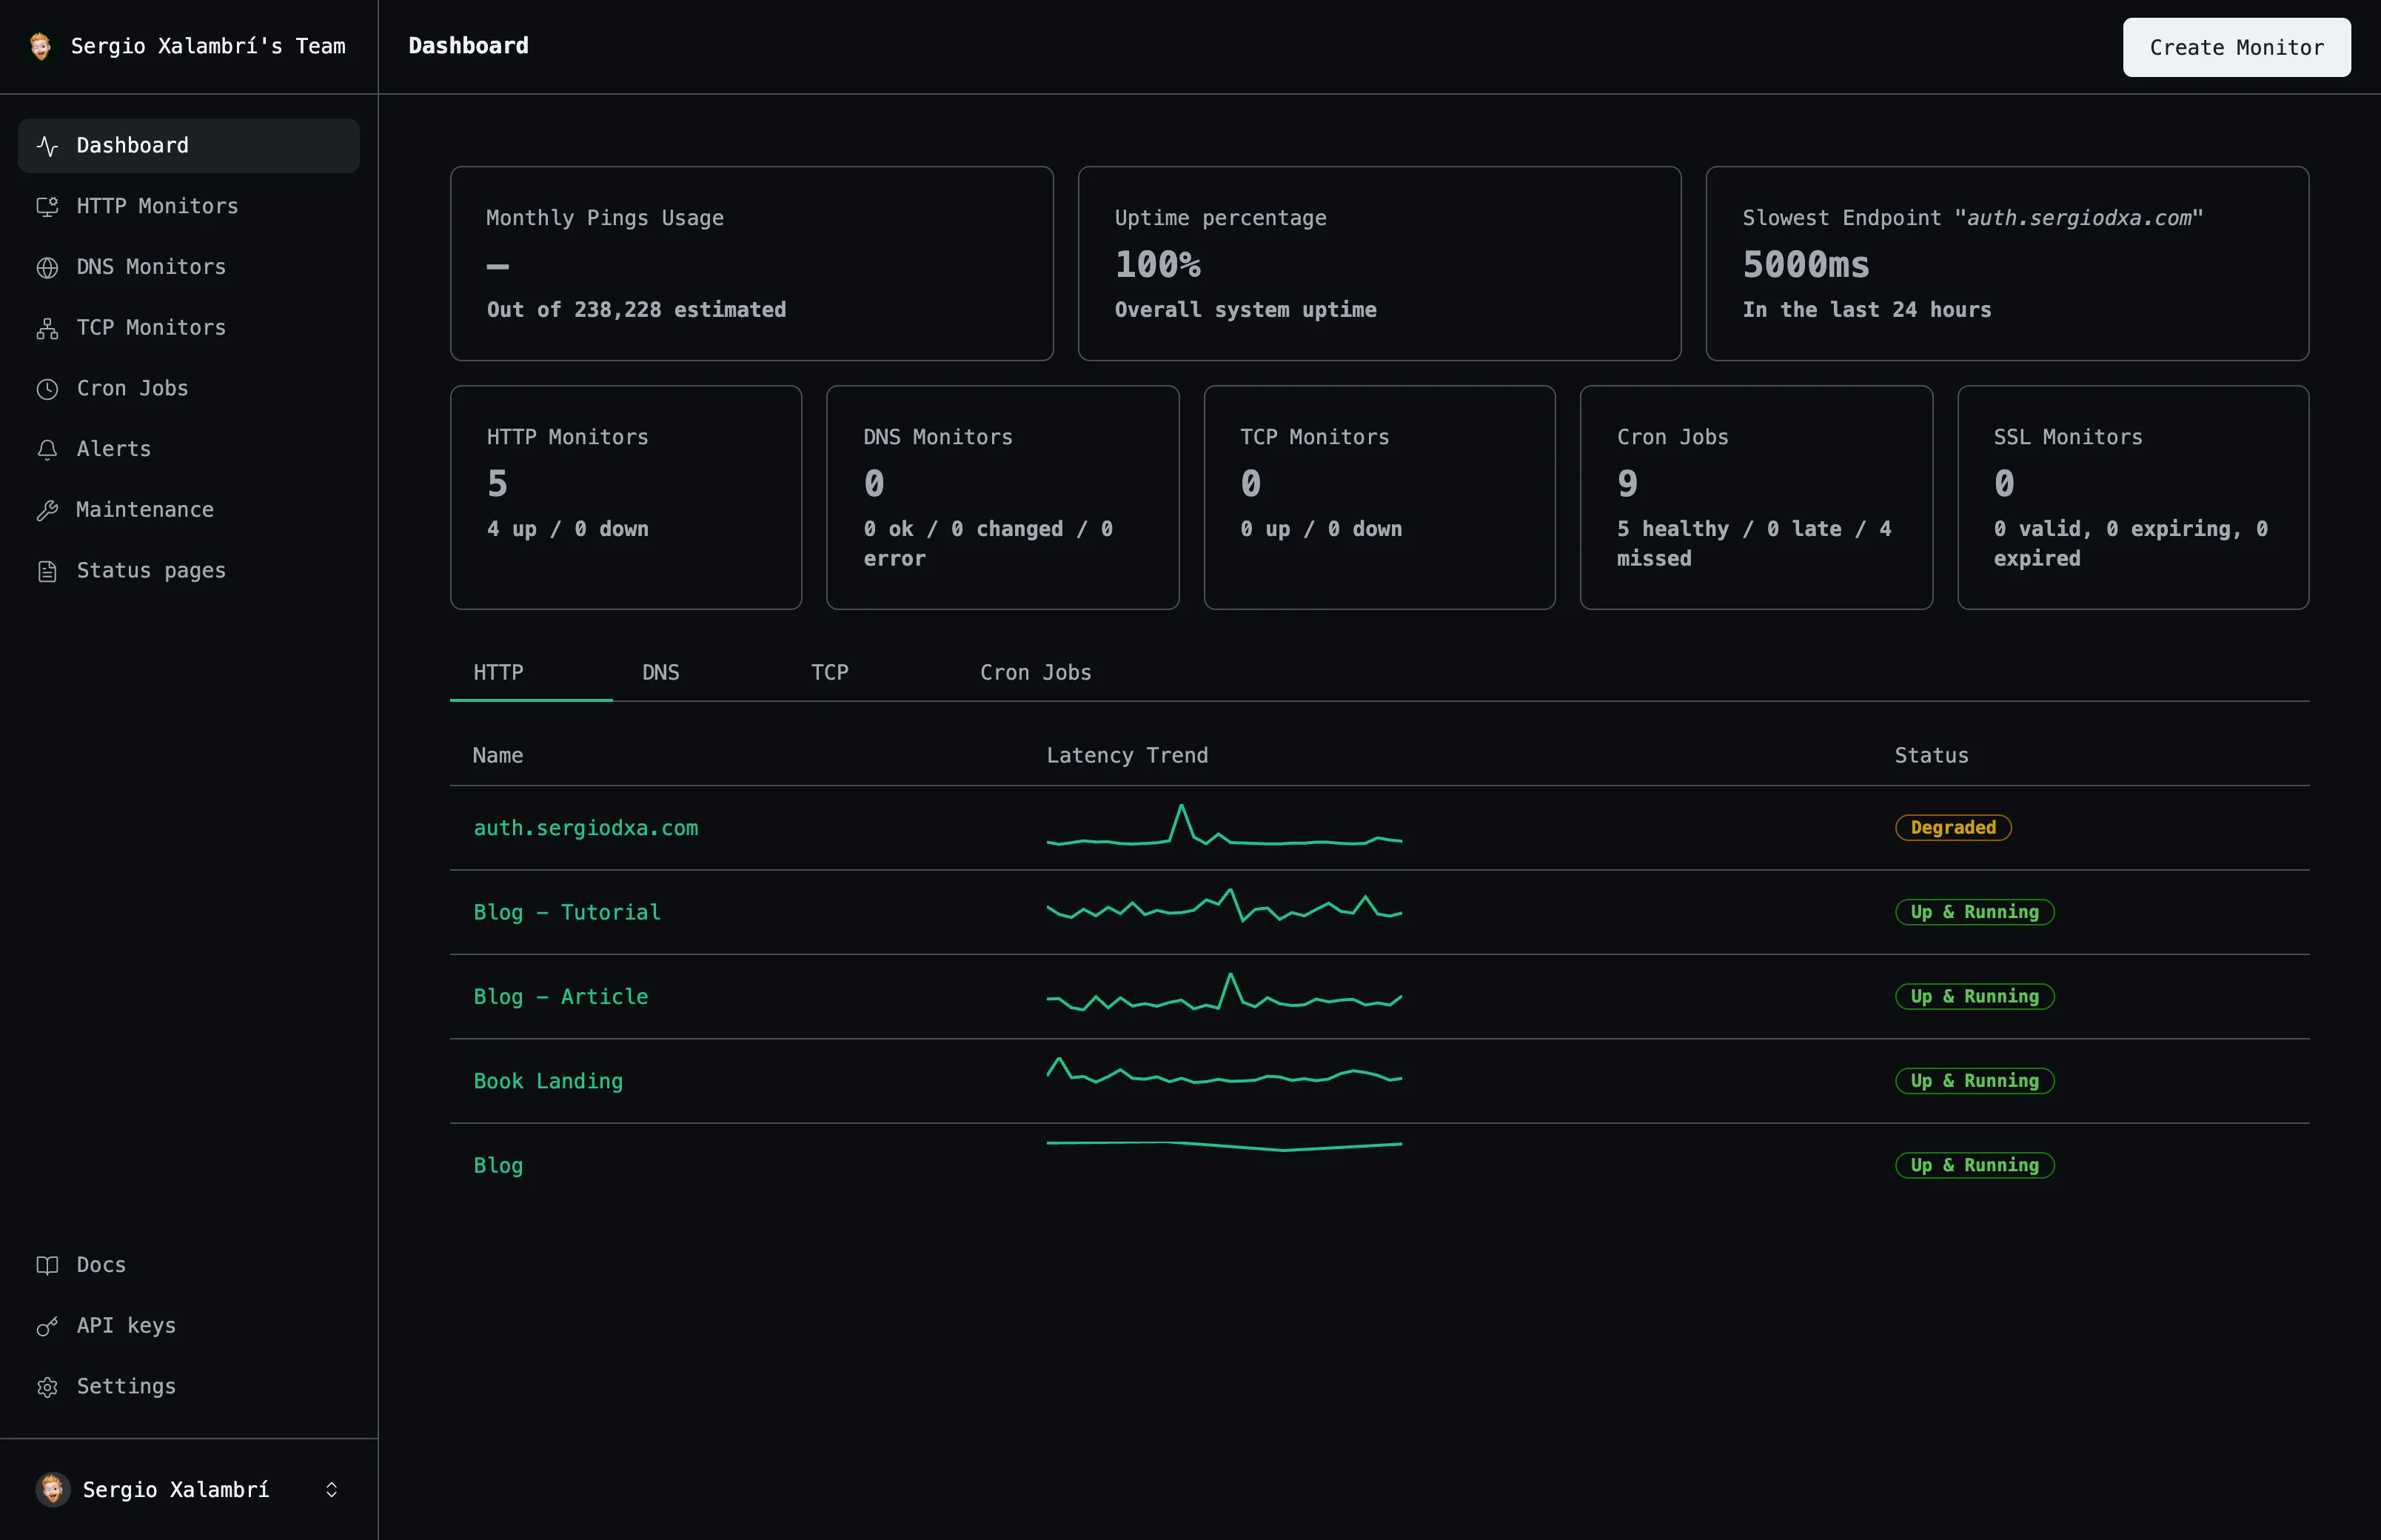
Watch the dashboard
See uptime history, response times, and status update as checks run automatically.
Frequently asked questions
The questions people ask most before they start monitoring.
Can I monitor authenticated API endpoints?
Yes — add custom headers, including Authorization tokens, to any monitor.
Can I check the response body, not just the status code?
Yes, with content checks for a keyword, phrase, or regex pattern.
Start monitoring your services
Create your first monitor in under 2 minutes. No credit card required to start.