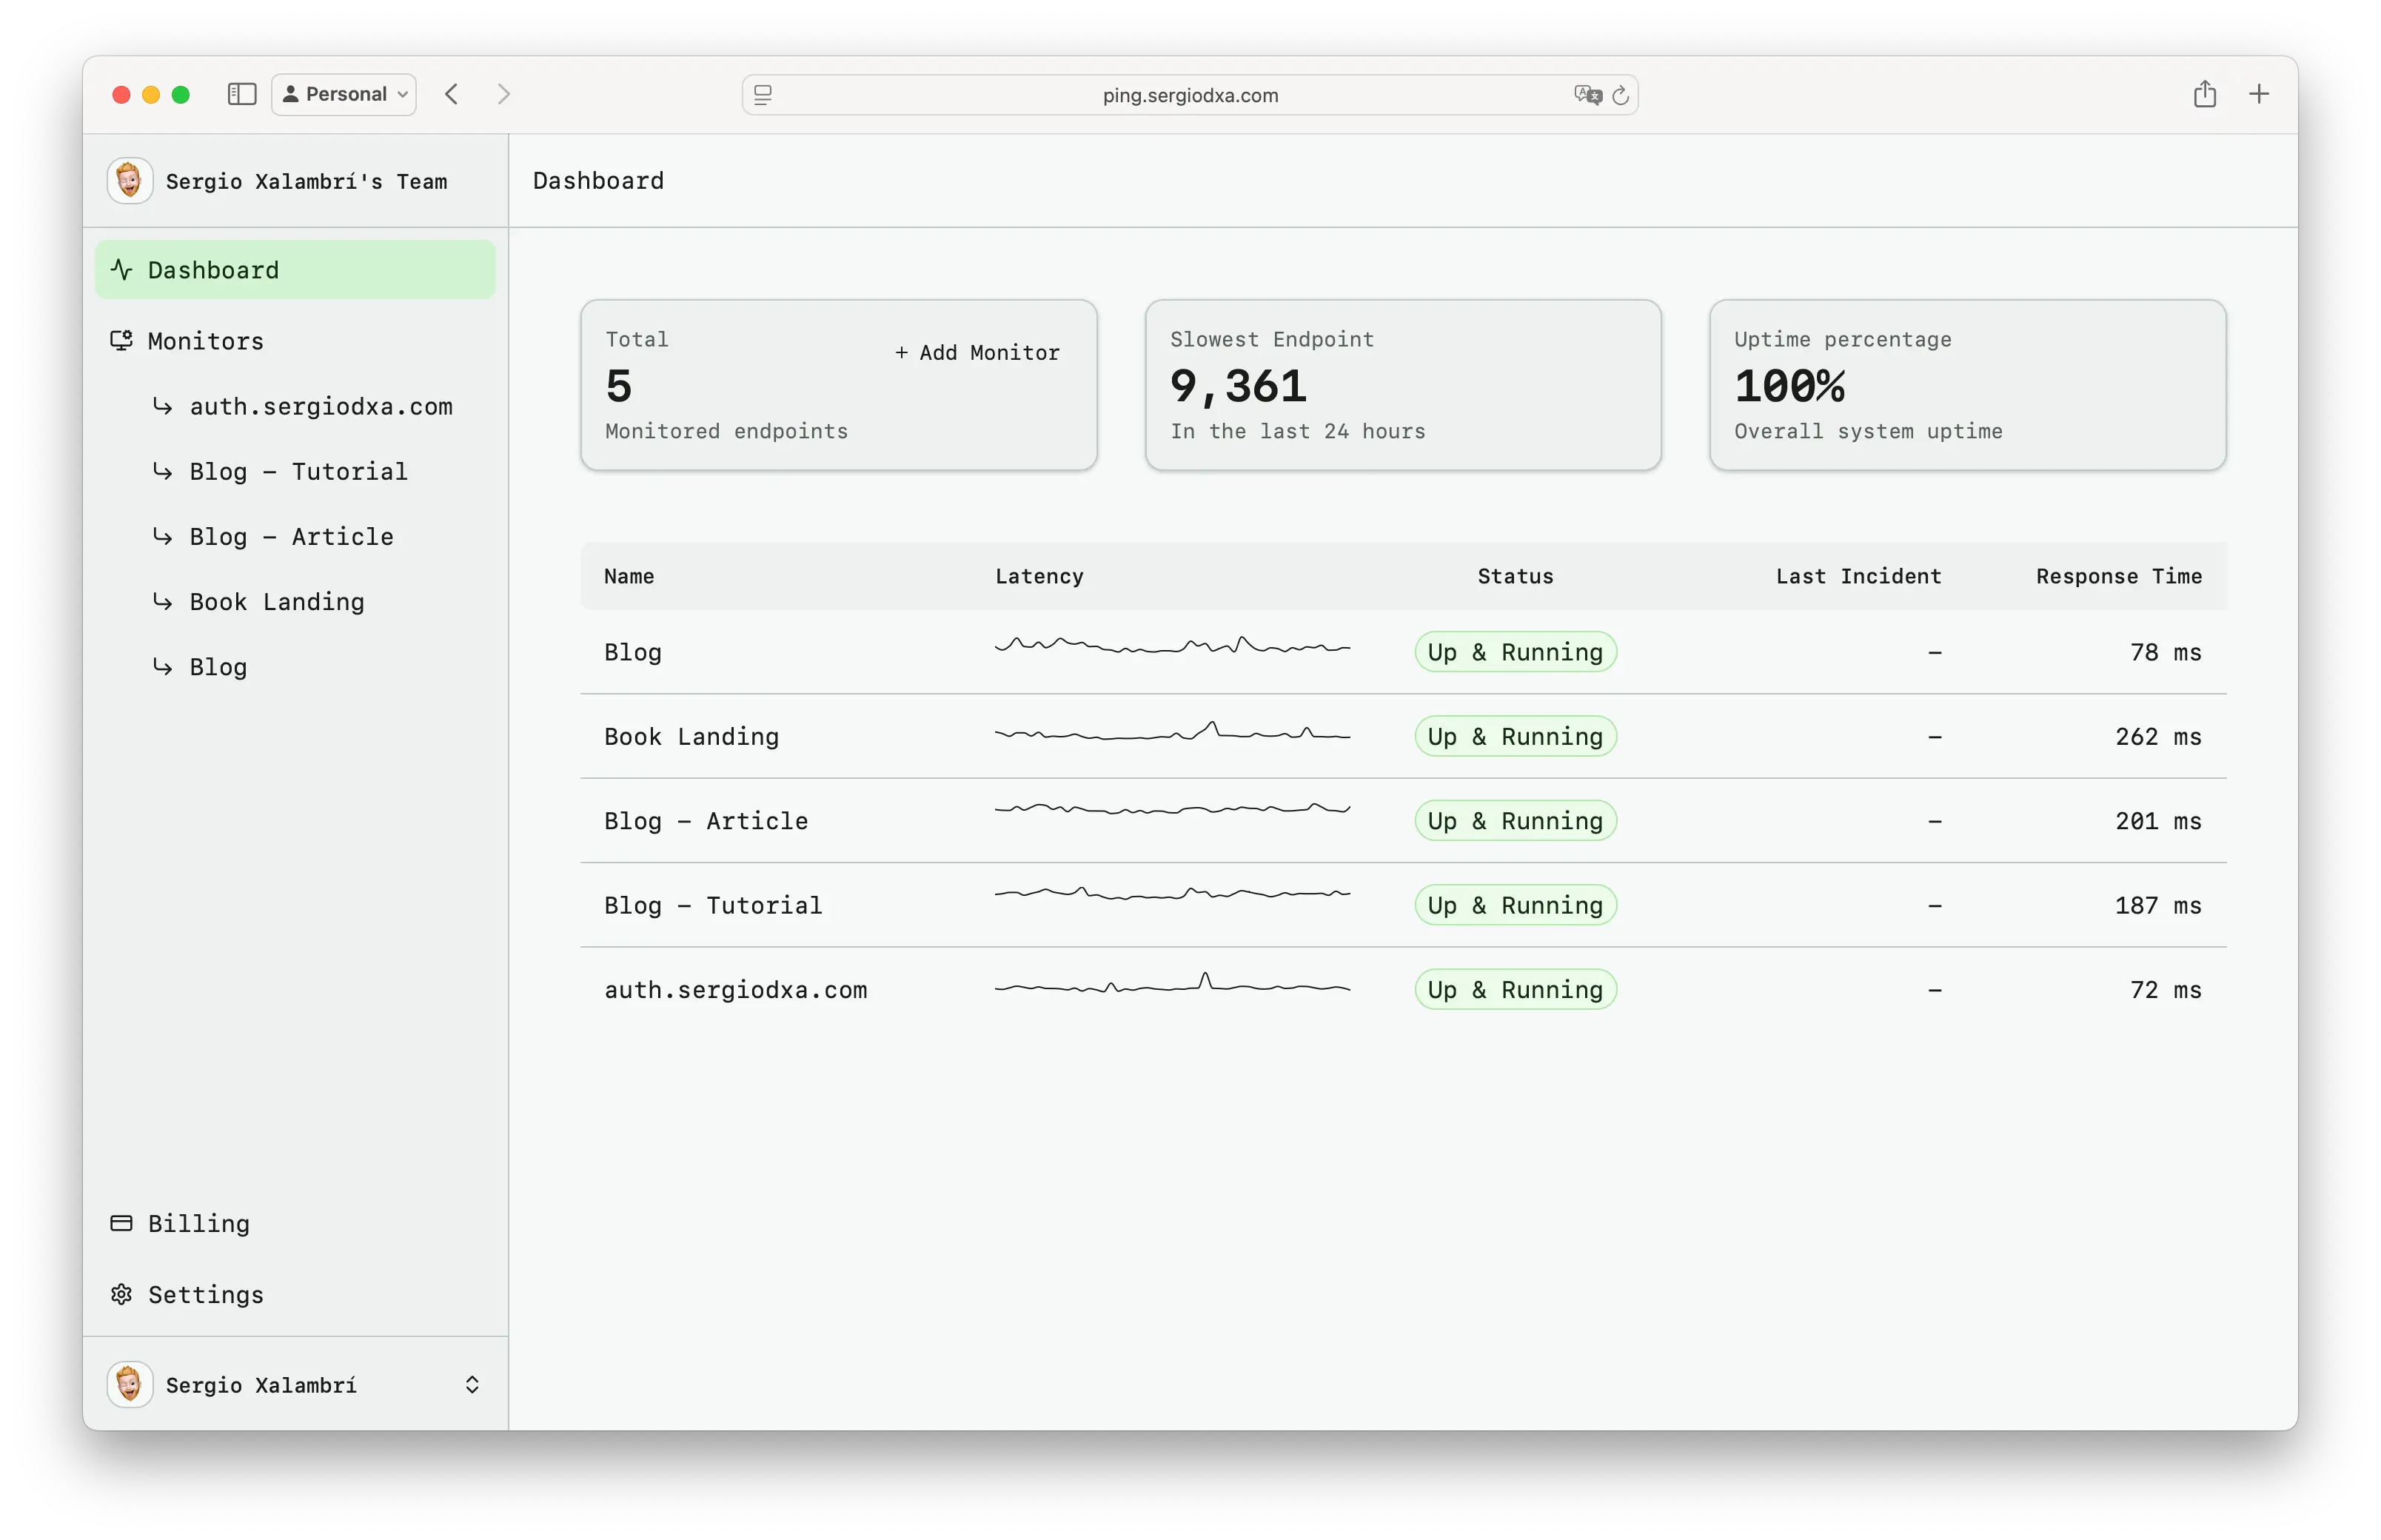
Know when your service goes down before your users do
HTTP health checks from 9 global regions. Monitor any URL with customizable intervals from 1 to 60 minutes.

Global Regions
Check Intervals
Health Checks
Data Retention
Everything you need to monitor your services
Comprehensive HTTP monitoring with global coverage and flexible configuration.
Global coverage
Monitor from Africa, APAC, Eastern/Western Europe, Middle East, Oceania, and the Americas.
Flexible intervals
Check every minute for critical services, or every hour for less urgent endpoints.
Status code validation
Expect any HTTP status code: 200, 201, 301, 404—whatever your endpoint should return.
Instant results
Run any monitor on-demand to test immediately after changes.
Heatmap visualization
See your service health at a glance with daily heatmaps showing success rates.
365-day history
Access a full year of monitoring data for trend analysis and incident review.
Get started in minutes
Set up your first monitor in three simple steps.
Enter your URL
Paste the endpoint you want to monitor—website, API, or health check route.
Configure checks
Set the interval, expected status code, and monitoring region.
Start monitoring
Automated checks begin immediately. View results in your dashboard.
Frequently asked questions
Common questions about HTTP monitoring.
Start monitoring your services
Create your first monitor in under 2 minutes. No credit card required to start.
Start Monitoring