Catch failures before they cascade
Monitor distributed systems and microservices architecture. Catch failures before they cascade across your infrastructure.
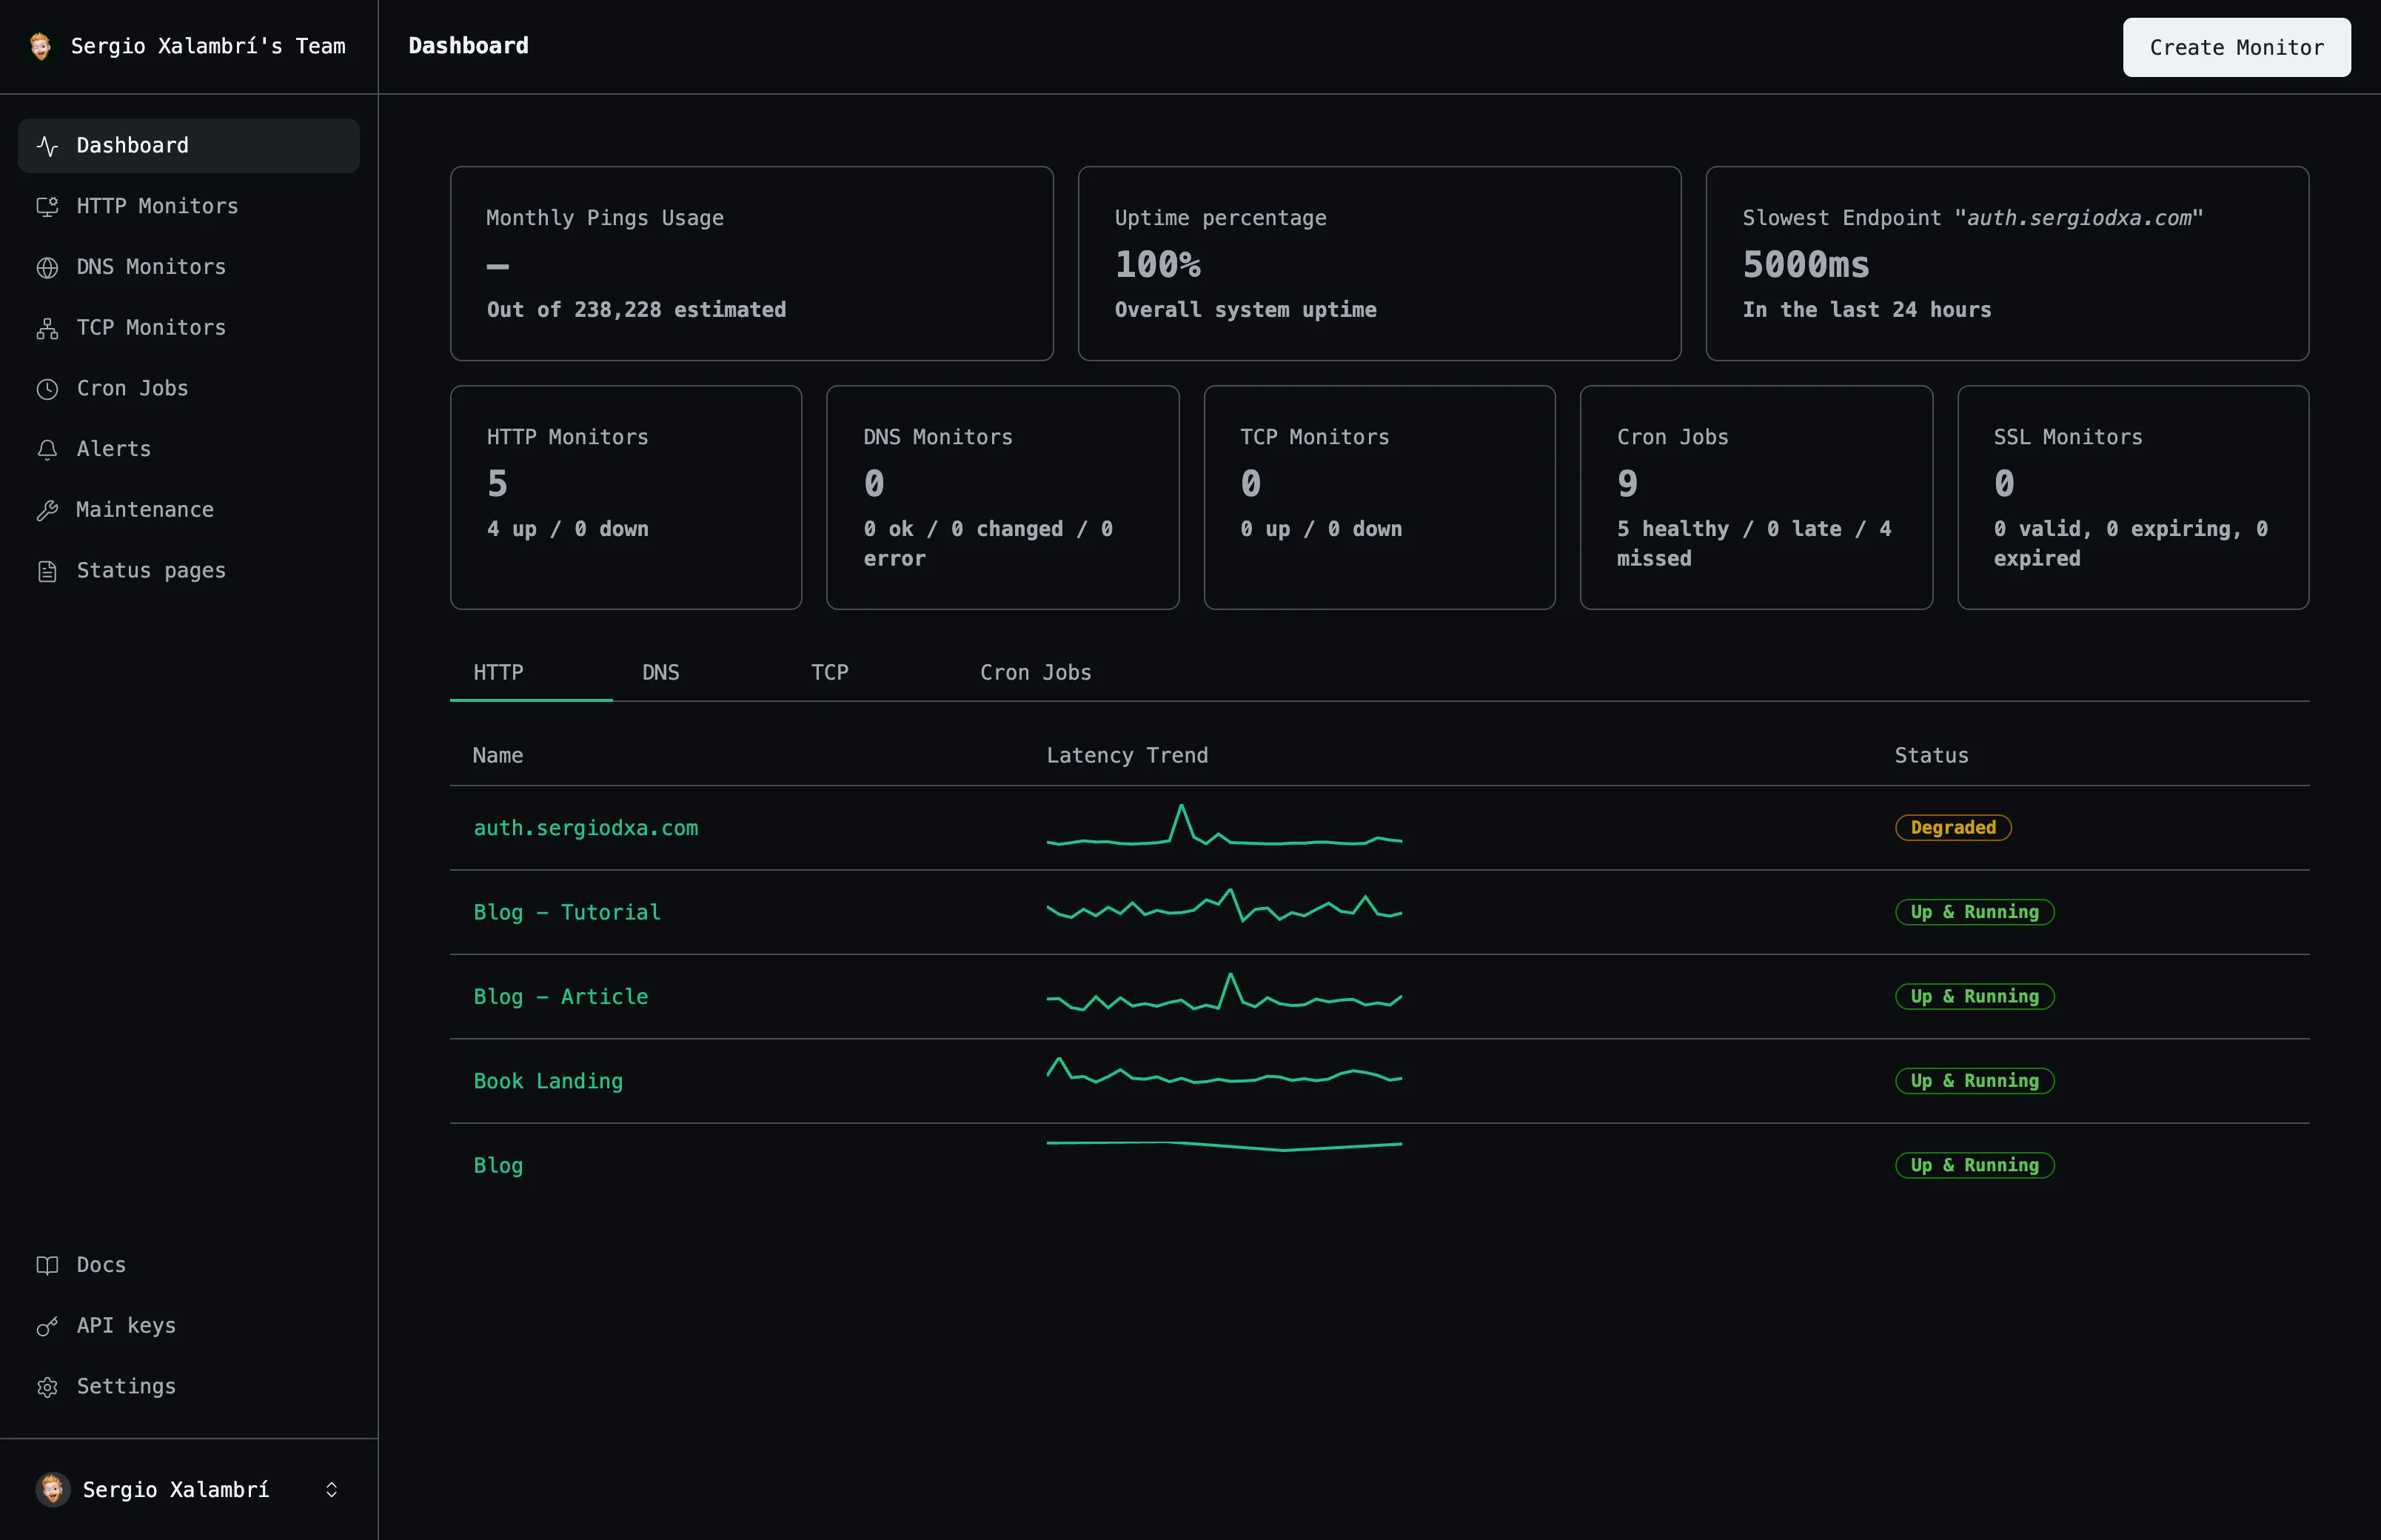
Services
Architecture
Health
Detection
Everything you need
A closer look at what you get, from the first check to the alert that reaches you.
One monitor per service
Isolate failures to the exact service that's down.
TCP port monitoring
Watch raw ports for services that don't speak HTTP.
DNS monitoring
Catch service-discovery DNS changes before they misroute traffic.
Independent alerting
Scope alerts to a single service instead of the whole system.
How it works
Three steps from an empty dashboard to checks that run on their own.
Create your monitor
Point Uptime at the URL, domain, port, or scheduled job you want to track.
Choose how you're alerted
Connect email, Slack, Discord, or a webhook. Set cooldowns to avoid alert fatigue.
Watch the dashboard
See uptime history, response times, and status update as checks run automatically.
Frequently asked questions
The questions people ask most before they start monitoring.
Can I monitor internal services that aren't public HTTP?
Yes — TCP monitors watch raw ports for internal or non-HTTP services.
Will one failing service spam alerts for everything downstream?
No — each service has its own monitor and alert, so you see exactly what broke.
Start monitoring your services
Create your first monitor in under 2 minutes. No credit card required to start.