How pricing works
- Base subscription
$5/month includes your first 100,000 pings
- Additional pings
$1 per 10,000 pings after that, billed in whole blocks
- No hidden fees
No extra charges for features or integrations. Pay for the pings you use.
Get instant alerts when your websites and APIs go down. Monitor your websites and APIs with ease.
No account needed. We'll run one check and show you exactly what a monitor would report.
Monitor Types
Global Regions
Days Data Retention
Min Check Interval
Three things that stay true however much you end up monitoring.
HTTP, DNS, TCP and SSL checks, cron job heartbeats, alerts and status pages. One plan, nothing sold as an add-on.
Unlimited monitors and unlimited team members. Add everything you want watched, and everyone who needs to see it.
$5 a month includes 100,000 checks. Past that you pay for the checks you actually run, and nothing else.
Everything you need to keep your services running smoothly, with no unnecessary complexity.
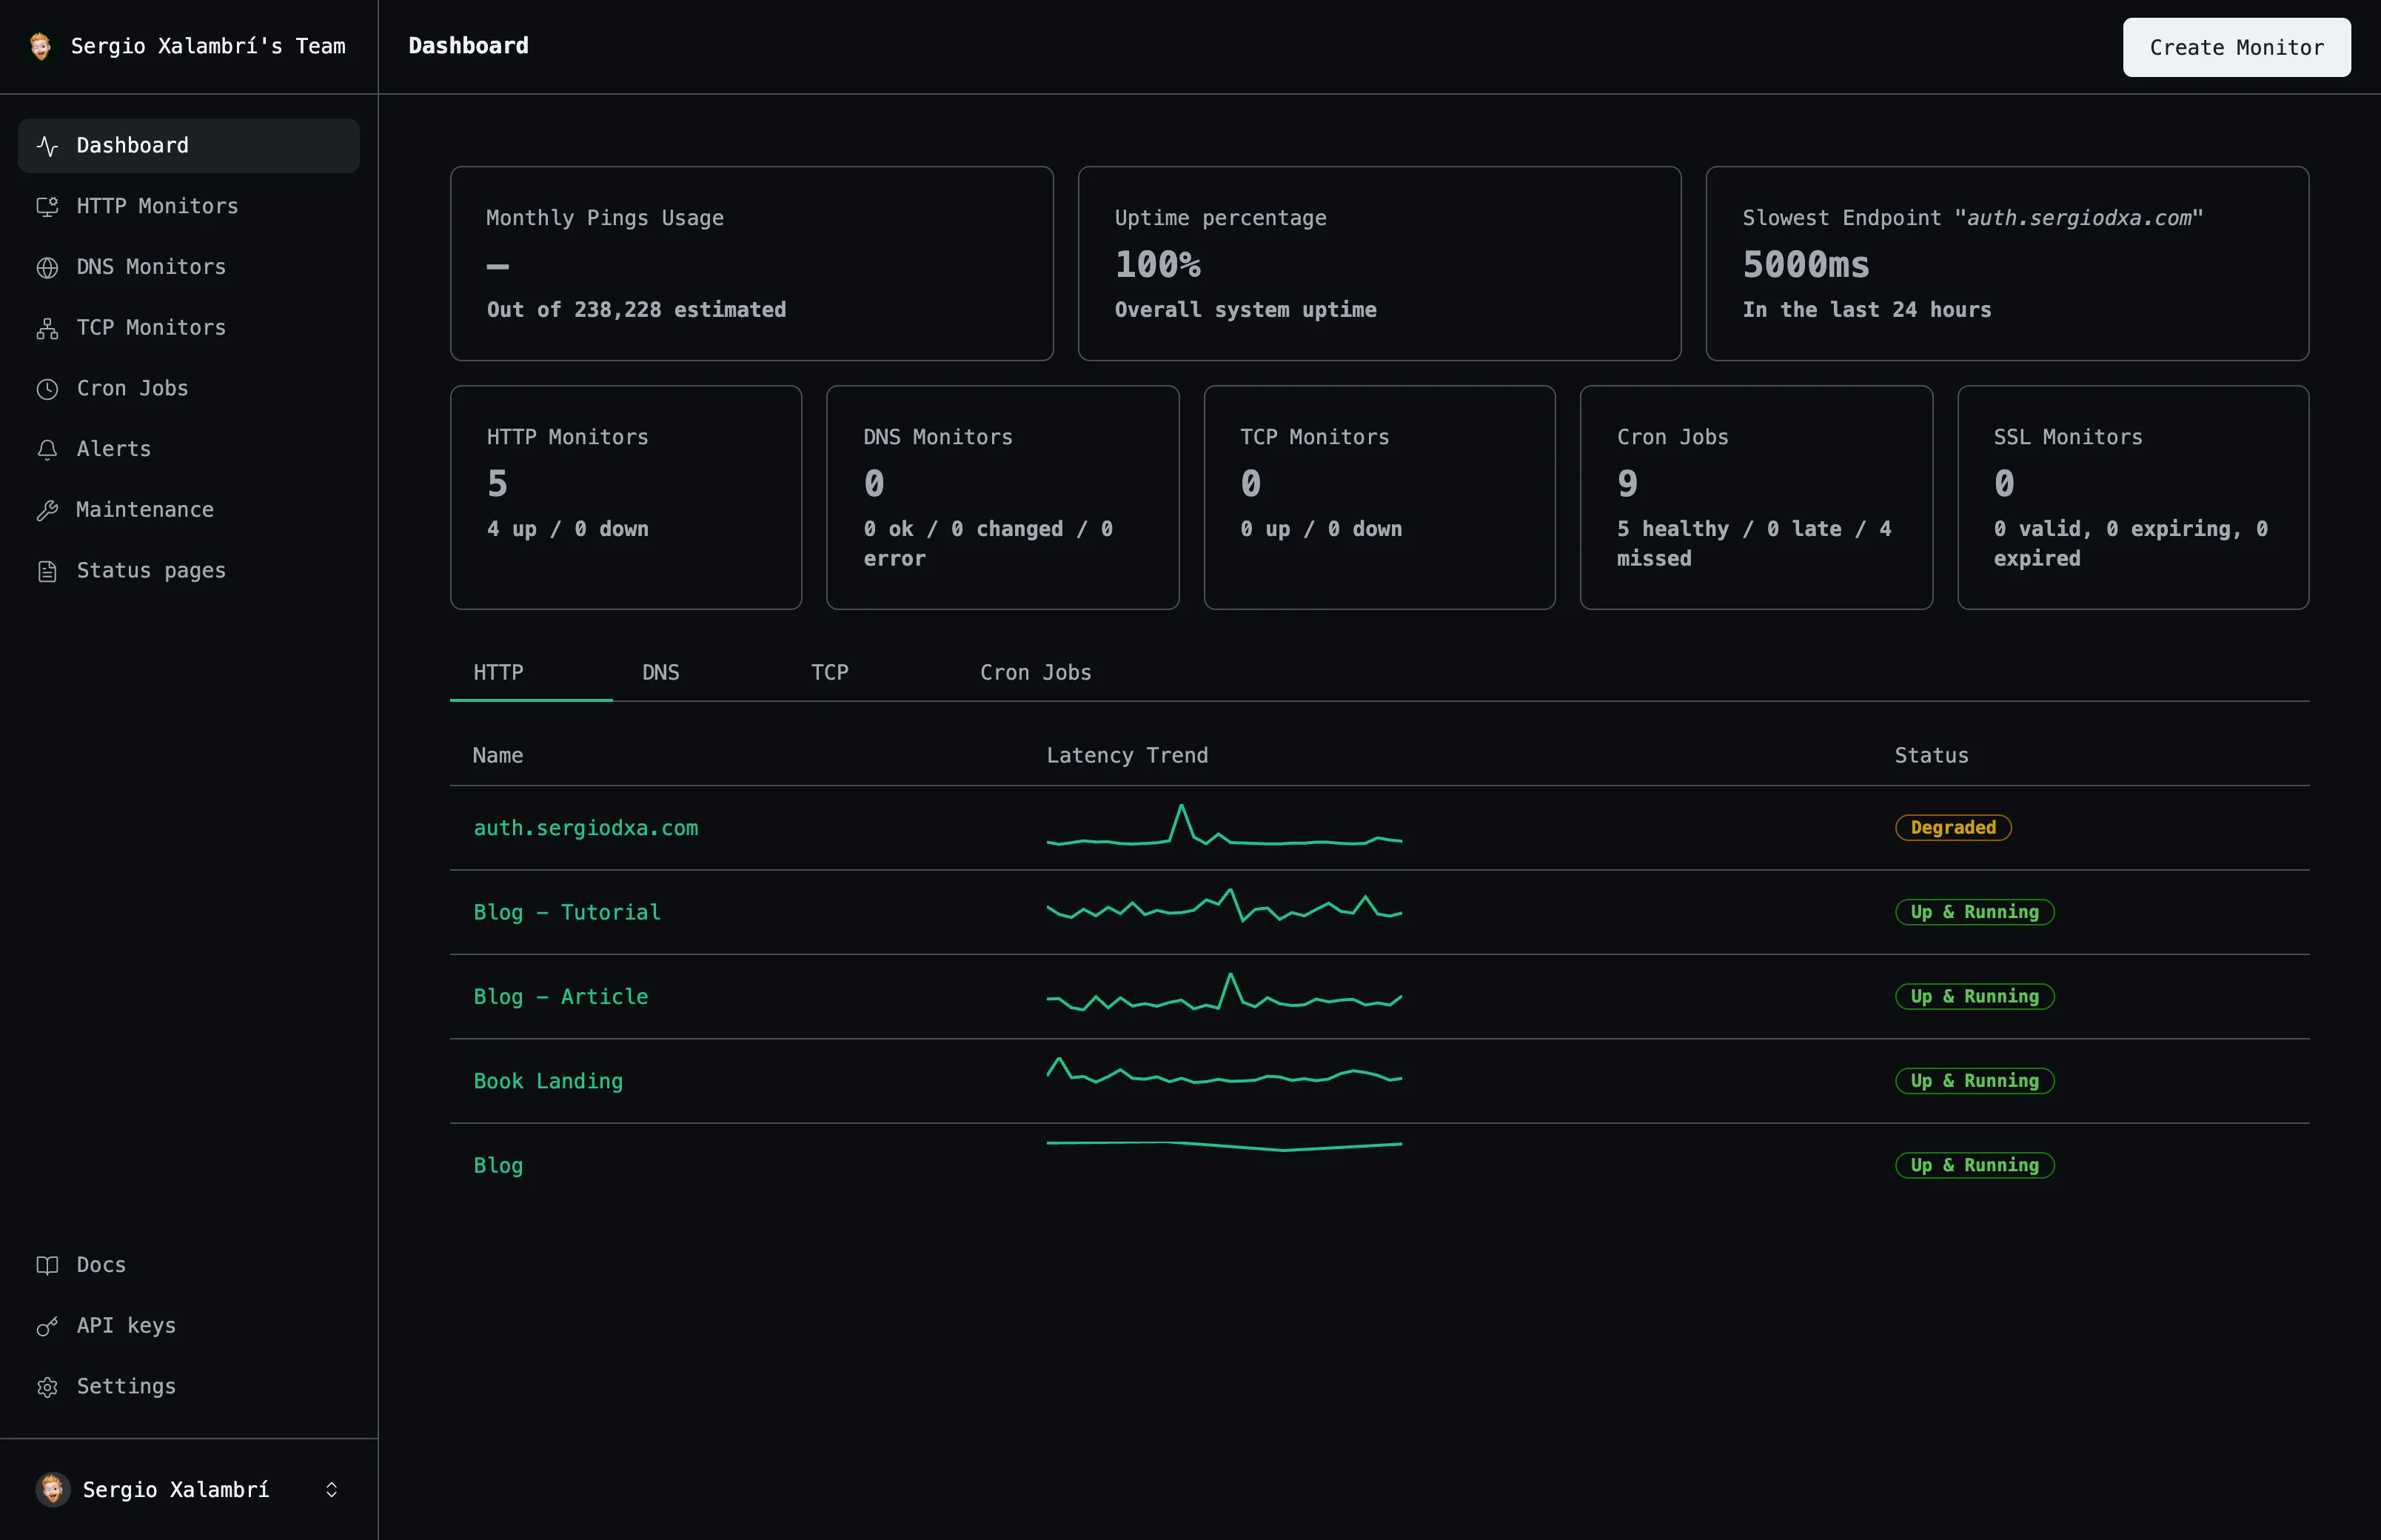
Track your services around the clock, from nine regions, at intervals from one minute. Get detailed metrics and performance insights at a glance.
Get instant notifications via email, Slack, Discord, or webhooks when your services experience downtime or performance issues.
Create beautiful public status pages to keep your users informed about service availability and incidents.
Track certificate expiry dates and get alerts before your SSL certificates expire to prevent security warnings.
Detect DNS record changes and propagation issues before they impact your users or get hijacked.
Direct Slack and Discord integrations with rich notifications, not just basic webhooks.
Run several requests in order and check what comes back — sign in, read the token, call the endpoint it authorises. The question a single check cannot ask.
Advanced capabilities that make monitoring effortless and comprehensive.
Schedule downtime and suppress alerts during planned maintenance
Verify specific keywords or content appear on your pages
Get notified when services come back up after an incident
Full REST API with key management for automation
Prevent alert fatigue with configurable cooldown periods
Add authentication headers and custom request parameters
Monitor scheduled jobs and background tasks with heartbeat checks
From simple health checks to complex distributed systems, we've got you covered.
Track uptime and performance for landing pages, blogs, and web applications.
Monitor REST APIs, GraphQL endpoints, and webhooks for availability.
Keep your SaaS product reliable with proactive monitoring and instant alerts.
Monitor distributed systems and catch failures before they cascade.
Verify service health and database connections with scheduled pings.
Monitor checkout flows, payment APIs, and product pages to protect revenue.
Tailored solutions for:
One subscription, no tiers. Pay only for what you use with our straightforward pricing model
Calculate your monthly cost based on your monitoring needs
Includes first 100,000 pings
0 × $1 per 10,000 pings (0 over)
$5/month includes your first 100,000 pings
$1 per 10,000 pings after that, billed in whole blocks
No extra charges for features or integrations. Pay for the pings you use.
Find answers to common questions about Uptime
Uptime sends regular HTTP or HTTPS requests to your endpoints. We check response codes and response times to determine if your service is available and responsive.
When Uptime detects an outage, it immediately sends an alert through your configured channels.
Yes, as long as your internal services are accessible from the internet. You can also configure custom headers to authenticate requests.
Just sign up, create your first monitor, and configure your alert preferences. You’ll be up and running in under a minute.
Yes! You can create unlimited monitors and trigger pings manually for free, forever. Scheduled automatic monitoring requires a subscription.
We store your ping results for 365 days. After that, they are automatically deleted.
Yes. You can set custom headers with tokens or credentials to authenticate your requests.
Yes. Just create a separate monitor for each URL. Each monitor can have its own check frequency, HTTP method, expected status code, and more.
Absolutely. Uptime is designed to monitor both websites and APIs. You can set the endpoint, method, headers, and expected responses to monitor your API effectively.
Yes. You can configure a timeout for each monitor. If the response takes longer than expected, it’s considered a failure. This helps detect slow services.
Yes. You can pause any monitor at any time, individually.
Yes. A ping is automatically triggered right after you create a monitor.
Yes! Create customizable public status pages to share your service health with users. Include any monitors you want and add your branding.
We store all past results so you get a full history. Performance trend charts are planned for a future release.
Email, Slack, Discord, and webhooks. Native integrations make it easy to get alerts where your team already works. Webhooks let you connect to any other service.
Yes! Each user starts with a team. Invite team members with different roles (Owner, Admin, Member). Domain auto-provisioning automatically adds users with verified company email domains.
Usage above the 100,000 pings included in your subscription is billed in whole blocks of 10,000 at $1 each — a single ping over starts a new block.
No. We never store body data. For extra privacy and efficiency, we recommend using the `HEAD` method.
Uptime supports monitoring from multiple regions: Africa, Asia-Pacific, Eastern and Western Europe, Eastern and Western North America, Middle East, Oceania, and South America. You can choose one region per monitor. The region is treated as a hint, the actual ping will originate from a server in or near that region.
Yes. A flow monitor runs several requests in order with assertions between them, so it can sign in, read the token back, and call the endpoint that token authorises. A flow runs at the HTTP level rather than in a browser, and only against domains your team has verified.