Professional monitoring on a solo budget
Start free, upgrade when ready. Perfect for portfolios, side projects, and the first real users of your next idea.
To Start
Min Interval
Days Retention
Regions
Everything you need
A closer look at what you get, from the first check to the alert that reaches you.
Free manual monitoring
Create monitors and trigger pings by hand, forever, at no cost.
Usage-based pricing
Automated checks are billed per-ping, so a small project stays cheap.
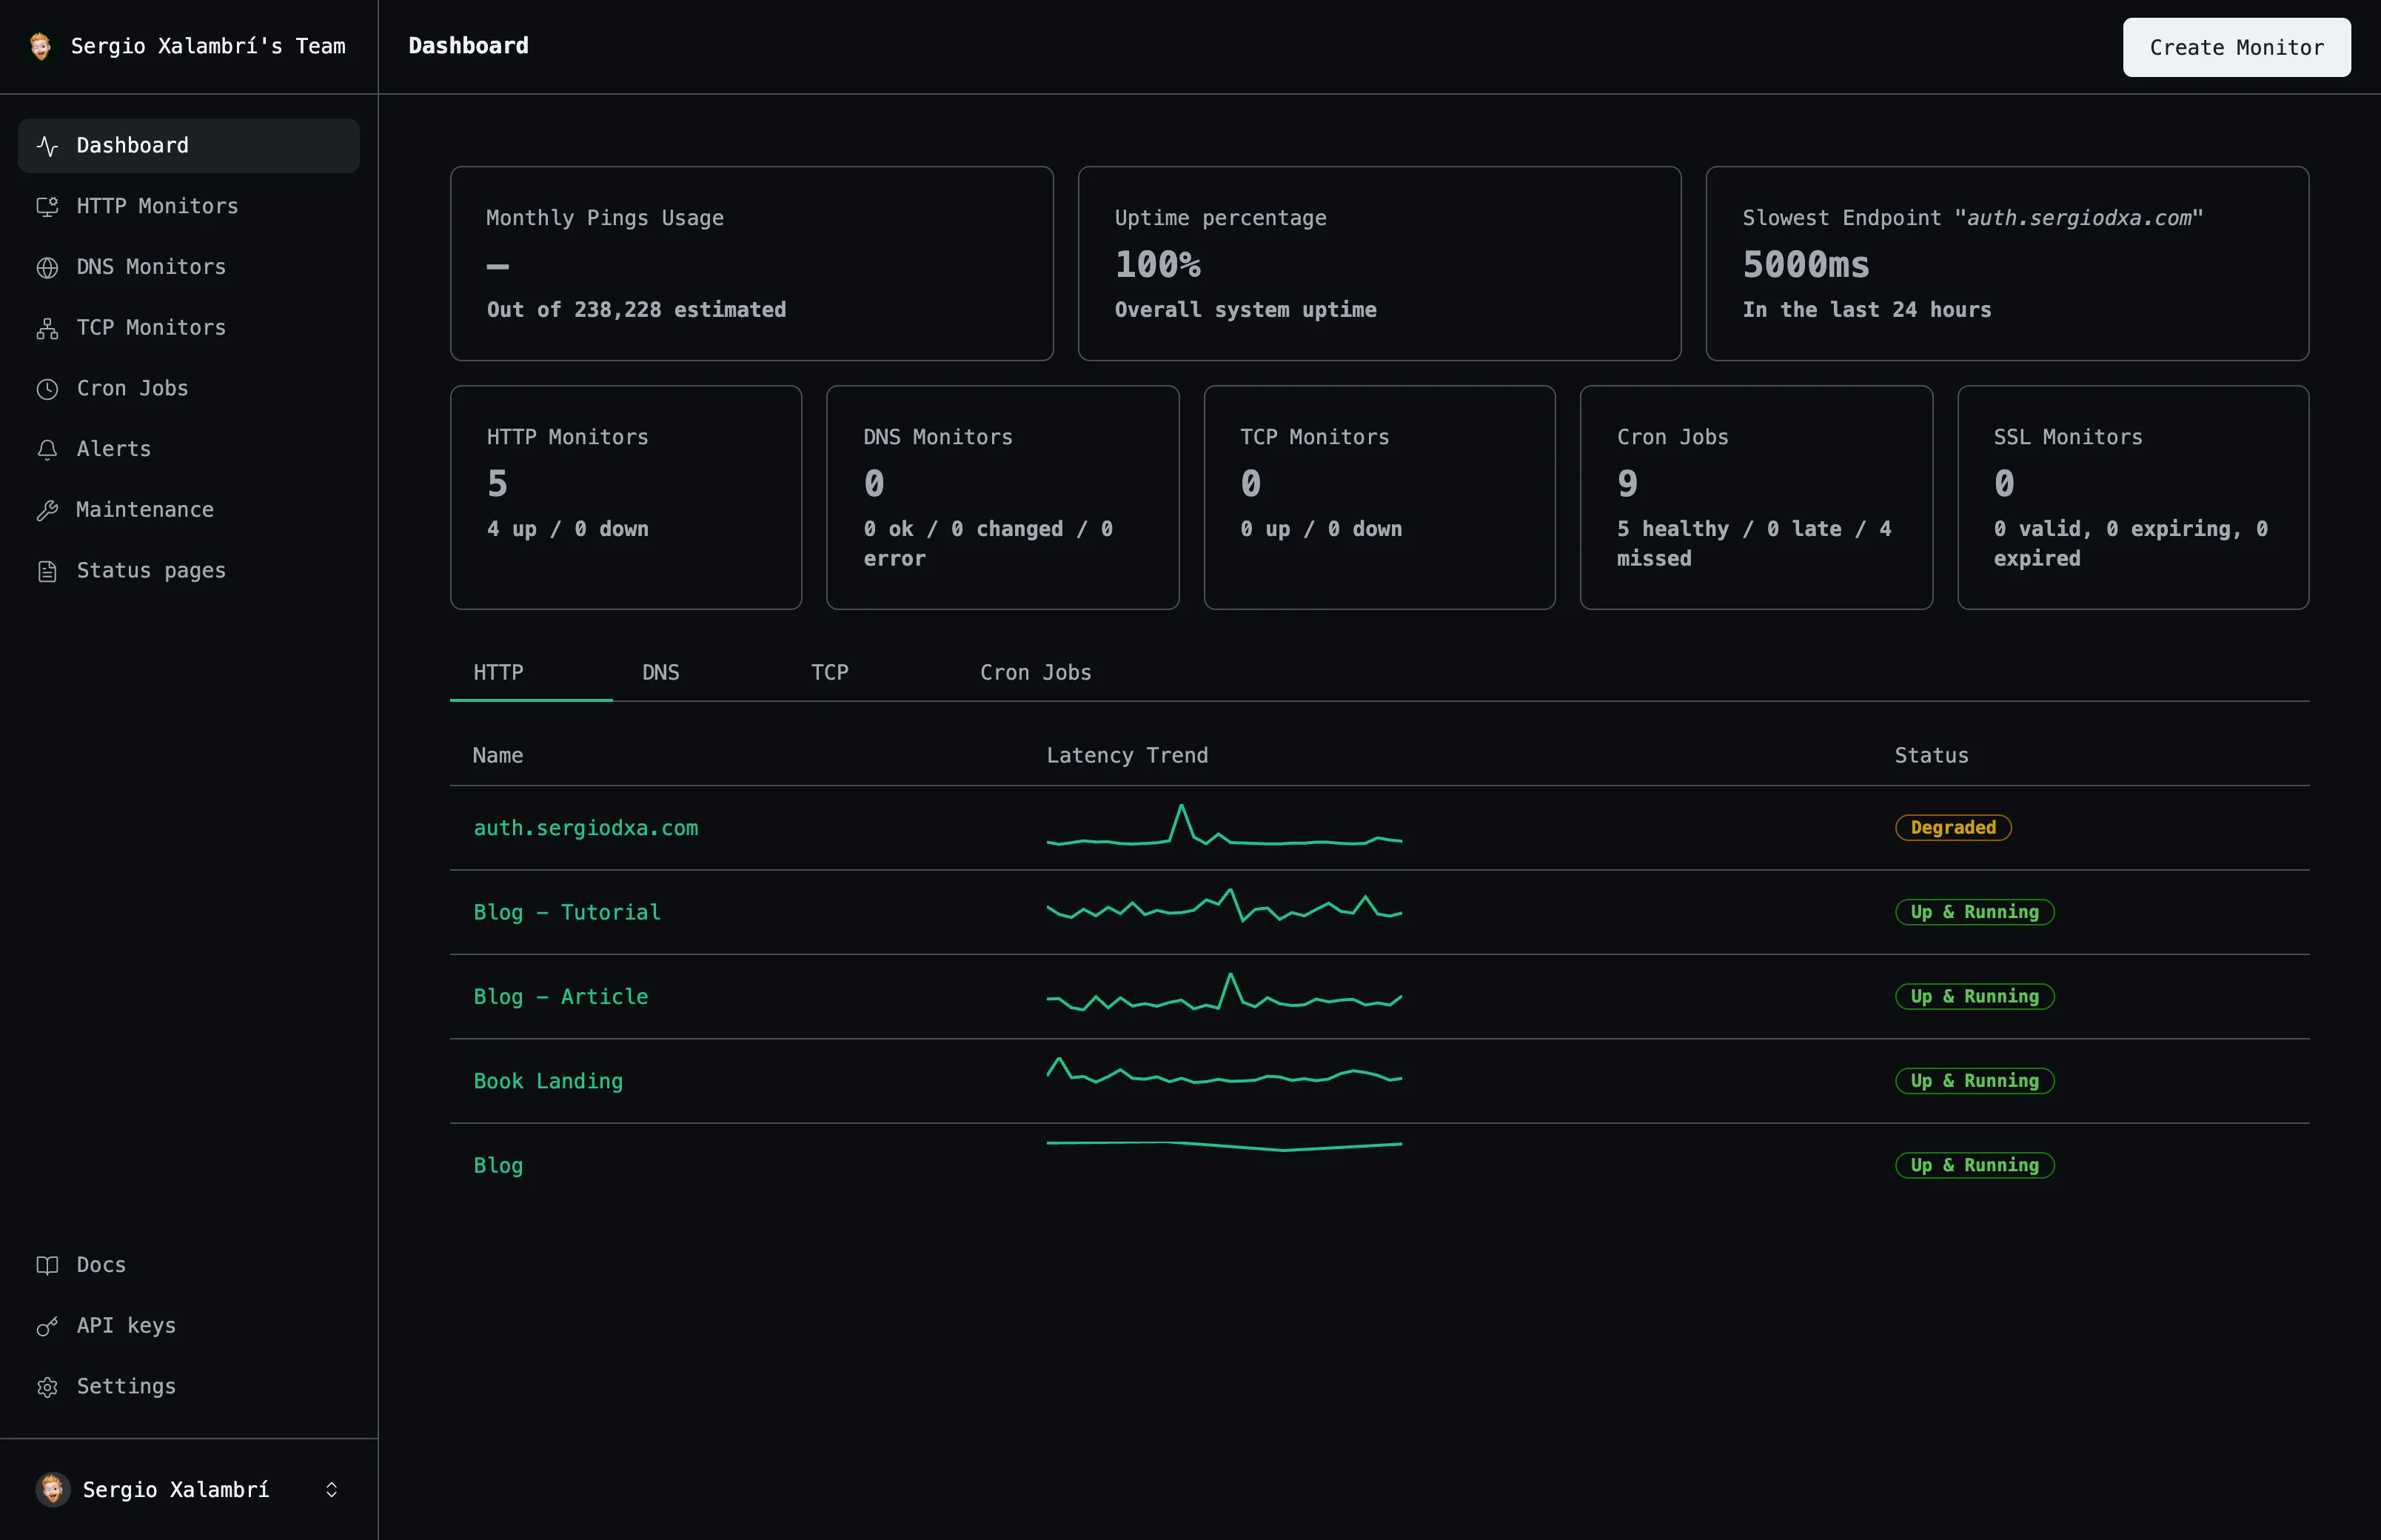
One dashboard
See every monitor's status and history in a single, simple view.
Alerts that reach you
Email, Slack, Discord, or webhook — wherever you already look.
How it works
Three steps from an empty dashboard to checks that run on their own.
Create your monitor
Point Uptime at the URL, domain, port, or scheduled job you want to track.
Choose how you're alerted
Connect email, Slack, Discord, or a webhook. Set cooldowns to avoid alert fatigue.
Watch the dashboard
See uptime history, response times, and status update as checks run automatically.
Frequently asked questions
The questions people ask most before they start monitoring.
Is there a free tier?
Yes — unlimited monitors and manual pings are free forever. Automatic scheduled checks require a subscription.
How much does automated monitoring cost?
$5/month includes 100,000 pings; additional pings are $1 per 10,000.
Start monitoring your services
Create your first monitor in under 2 minutes. No credit card required to start.